Friday, September 30, 2005
HOT TOPIC
Trial of Experimental Avian Flu VaccineMar 24, 2005, 05:24
“While there have been relatively few cases worldwide of H5N1 avian influenza infection in humans, the public health community is concerned that the virus will develop the capability of efficiently spreading from human to human and thus create a risk for a worldwide pandemic”
By NIAID, Fast-track recruitment has begun for a trial to investigate the safety of a vaccine against H5N1 avian influenza, the National Institute of Allergy and Infectious Diseases (NIAID), part of the National Institutes of Health (NIH), announced today.
Sites in Rochester, NY, Baltimore and Los Angeles will enroll a total of 450 healthy adults. The clinical sites are part of the NIAID-sponsored Vaccine and Treatment Evaluation Units (VTEU).“While there have been relatively few cases worldwide of H5N1 avian influenza infection in humans, the public health community is concerned that the virus will develop the capability of efficiently spreading from human to human and thus create a risk for a worldwide pandemic,” says NIAID Director Anthony S. Fauci, M.D.“NIAID has supported research on H5N1, the strain responsible for this deadly form of avian influenza, since 1997 when the first cases in humans were reported.
The initiation of this vaccine trial marks a key advance in our efforts to prepare to respond to an avian flu pandemic,” adds Dr. Fauci.Sanofi pasteur, Swiftwater, PA, manufactured the trial vaccine, which is an inactivated vaccine made from an H5N1 virus isolated in Southeast Asia in 2004. Sanofi pasteur, formerly Aventis Pasteur, was awarded a contract by NIAID to manufacture the H5N1 vaccine in May 2004.
This Phase I trial will test the vaccine’s safety and ability to generate an immune response in 450 healthy adults aged 18 to 64. If the vaccine is shown to be safe in adults, there are plans to test it in other populations, such as the elderly and children.H5N1 avian influenza leads to severe disease in both birds and humans. Between January 2004 and March 11, 2005, there were 69 confirmed cases of and 46 deaths from H5N1 infection in humans reported to the World Health Organization. To date, there has been a small number of cases where human-to-human transmission of the virus may have occurred. However, public health experts fear that the virus may evolve into one that is more easily transmitted between people. If this were to happen, a worldwide pandemic could follow.Influenza pandemics are global outbreaks that emerge infrequently and unpredictably and involve strains of virus to which humans have little or no immunity. H5N1 is one such flu virus strain. The last influenza pandemic swept the globe in 1968; many public health officials believe the world is overdue for another one.
APPROACHING INSANITY
http://research.stlouisfed.org/publications/usfd/page3.pdf
Trying to head off historic weak OCT? I don't know, but this bitch is popping in CRISIS MODE! What a move!
D
Trying to head off historic weak OCT? I don't know, but this bitch is popping in CRISIS MODE! What a move!
D
FRI AM DATA ALERT
http://briefing.com/Silver/Calendars/EconomicCalendar.htm Personal income DOWN .1%
WHERE'S the damn BEEF!!!!!! Consumer Spending DOWN a whopping .5%
Spending follows sentiment , and so will market IMHO
D
WHERE'S the damn BEEF!!!!!! Consumer Spending DOWN a whopping .5%
Spending follows sentiment , and so will market IMHO
D
FALL IN CONSUMER SENTIMENT "HEATING UP"
http://money.cnn.com/2005/09/29/news/economy/heating_costs/index.htm
It is normal for profits and the stock market to FOLLOW Consumer Sentiment, which has already fallen dramaticaly. Now the BULLS think it sjust a one time gulf effect, but a lot more attitude depressing news is being turned out by the media. HOME HEATING WOES ARE NOW DAILY CONCERN as winter approaches.
152 weeks of unbroken bullish plurality in the markets (investor intelligence polls)
Do you know the last bear market neded with 40 plus weeks of bearish plurailty? Did you know that since 2000 bubble top we have had only 9 weeks total of same??
And did you know that the gulf energy situation was as this article describes?
Even as MEDIA says investors feel WORST IS OVER? THAT ALL IS WELL IN THE GULF? After reading attached link do you stil feel that way?
TOP IS IN IMHO and BOTTOM is nowhere in sight. I may be early but I damn sure dont want to late in getting to cash!@
Duratek
LONG IN THE TOOTH
Call me crazy, but a down cycle in the US economy and stock markets is upon us, and if it hasn't begun it could at ANY MOMENT!
WHY? Did I escape out of my straight jacket?
Even Richard Russell, even though energy stocks have gone through the roof is suggesting several ETF'S to enter, and even though Utility stocks have closed near all time highs, and yield scant returns compared to past yields are among his favorite picks.
My complaint with this is, he may be herding the last of lemmings into a sector that is already bursting with bulls!!!! And Ute stocks have soared, partially because of energy and the search for yield pushing investors one sidedly so to the sector.
How do we spot signs of a top of a given item? Sometimes news stories give us a clue and bullish sentiment.
MANY books now coming out calling for "PEAK OIL" and "ENERGY CRISIS" and if you think how hard it would be to predict A) Demand in future and B) Supply and qty of reserves it is a foolhardy task. BUt I believe this is a telltale sign the top is in or near in energy and oil prices.
Bullishness is off the charts and EVERY DIP is being bought. The chart of OIL (symbol $WTIC) shows the top at $55 looking the same as the top at $67 (closing price). MACD looks like a double top and turning down with a hair weaker RSI (relative strength). Use stockcharts.com
to see the 10 yr chart. I am not saying oil couldn'tgo higher, just the table is set for it to do what the herd thinks it couldn't.
Now Cramer is liking GOLD! It has hit mainstream media, and is quite the talk, with 10 day RSI over 81% BULLISH is almost everyone all aboard the gravy gold train?
Gold is a lousy investment, pays no interest, ONLY rises in periods of inflation then falls rapidly like it did from the 70's highs. Long time gold bugs are holding gold at $850 an ounce! from over 20 years ago! what is todays price? near $475 !
Silver is under $7.50 and over 20 years ago it hit $50 !!! is Silver a good investment? The metals are a TRADE, can you go to corner drug store and buy Asprin with gold coins?
I HATE FIAT currency, don't get me wrong, and maybe not a bad idea to hold some gold coins, and buy the stocks LOW, but at some point you will need to convert you metal to a non shiney FIAT to actually buy something. When you have hundred of millions of people use to paying with paper, that is how it is.
Now the smart thing is to hedge by buying stronger paper, like the Canadian fiat or as EWT suggests a "stable currency fund" which is set up to RETAIN your BUYING POWER, now that makes great sense and is now available. IMHO
Short the market? not for everyone, but actually if you just hold CASH and if stocks FALL over the coming years, and you can buy GOOD companies on the cheap at reasonable or below KNOWN prices, you basically have! 100% invested for most will be financial suicide!
Last comment on gold (YES ITS ONLY REAL MONEY) who is asking why gold at 17 yr high and silver cant get above 2004 high of $8.50?? being IGNORED I believe speculators are in gold big time now, so be careful I think volatility could pick up intensely.
The gulf rebuild is going to take MUCH longer than anyone can imagine, and who is sure the entire area isnt now a toxic waste dump? How safe would it be to come back? WHat about all those mortgages? WHO could come back if no schools for children? drinking water or electricity?
And with the NO BID contracts, our tax dollars will go to waste! and abuse!
I am focused on the debt issue. Deflation normally is a factor at play with historic debt afoot. (last time see 1929!)
WE have surpassed the 1930 high of TOTAL CREDIT MARKET DEBT BY 30% !!! And yet the bulls think the FED can just KEEP dishing out the FIAT, and it will just keep piling up on top of the already historic conditions? and give same results as the past?
ALso missing? wage growth present in every recovery from recession is absent from this one, and has helped to take savings down to below ZERO!
NO!!!!!! We are getting less bang for the buck!!! It is obvious from the data. ALL CYCLES come to an end! IF we are already PAST 30% previous 100 year highs in debt and credit inflation how could YOU be complacent about our current environment?
Yet you ARE! the VIX sits near its BUBBLE BULL mkt lows! And the relationship between stock market price and complacency is also obvious
OCT is historically bearish, but who is worried?
The dollar has strengthened somewhat, why do you suppose? It wouldn't be because of inflation.
WHAT sector in market hasn't been played?
There are hints INTEREST RATES are turning up! (all blue words are live links) NORMALLY long term rates follow short term rates, I think GOOD chance that may be finnally happening as this chart implies. 20wk trying to turn up thru 50wk and could provide support below. MACD is rising (MOMO)
Switching to daily chart from weekly we see 20 EMA HAD broken up and both 20 and 50 and now RISING. we also have series of 3 higher lows.
Rising interest rates and debt are characteristics of the onset of DEFLATION, though rates should actually DROP when deflation is in full bloom to try and invigerate economy. BUT we shot that arrow, real estate has EXPLODED beyond any previous BOOM, so that arrow in quiver has been played and so has autos! "you pay what we pay" maybe the signal of end of road.
Bears are actually in this market big time playing it for al its worth LONG! the table is set, and thought I dont know the spark that will light the fuse for an earnest decline to begin, I DO know the powder is bone dry. Be careful.
Duratek
Thursday, September 29, 2005
HELP WANTED NOT?
Help Wanted Ads Show Weak Demand for New Employees (from 2002!)
and check out this chart
The “help wanted” advertising index—which tracks the volume of job openings posted by employers in 51 major metropolitan newspapers—is a good indicator of current employment trends. The shaded vertical areas shown in the chart represent recessions since 1970. As expected, throughout each recession the “help wanted” advertising index fell. The index sharply increased immediately for all subsequent recoveries except for two. The index continued to fluctuate on a downward trend for 11 months following the March 1991 recessionary trough, but thereafter steadily trended upward for 35 months. The index again fell sharply through the most current recession but has continued to trend downward since the 2001 recessionary trough that occurred 22 months ago. This index reflects the continued hesitation of employers to hire new workers during this prolonged weak recovery.
Today's data Help Wanted drops from 39 to 35 reading! When you look at 25 year historry of that, helps to put this period into perspective
Duratek
Wednesday, September 28, 2005
LNUX a never was?
http://finance.yahoo.com/q/it?s=LNUX If they ain't buying I ain't buying, and they are STILL selling at these nothing prices!
THIS pos WAS $250 in 2000 buble top ! Well this market seems to be all about energy, and they dominate the new highs. And they are ovebrought, and WHO doesn't think energy costs are going to the moon? WHO doesn't won some energy stocks? Might they be near some kind of record bullishness? THIS contrarian scratches his head wondering if the opposite side of this trade is going to materialize and why! But thinks that it will.
D
STANDOFF AT PRECIOUS METAL CORAL
You Can’t Always Get What You Want
By: Theodore Butler
The most recent Commitment of Traders Report (COT) indicated that the tech funds had, effectively, increased their long position in COMEX gold back to a record, while the dealers increased their short position to a reciprocal record. Thus, we are in a high-risk state in the gold market for a sell-off down through the moving averages. Of course, that does not preclude new highs first or tell us much about timing. And it is always possible for the dealers to be overrun, although that is still yet to occur in memory in gold and silver.
Although there is continued increased attention and commentary on COT analysis in gold and silver, I am somewhat taken back by the underlying current of thought that holds that the COT market structure is somehow peripheral to why the market moves short term and the great anticipation (hope?) that the dealers will get slaughtered in a self-induced orgy of short-covering. Don’t misunderstand me, seeing the dealers lose big and thus ending the illegal price dominance of paper trading will be a day of great personal celebration for me and all free market advocates. But it may be premature to dance in the end-zone and slap high-fives. As I have written previously, these dealers are harder to kill than Dracula.
It is important to put the COTs into proper perspective. They are not the underlying force to long-term price movements, but rather are responsible for the $30 to $50 intermediate term moves in gold, in my opinion. While it is true that gold rose more than $200 over the past few years with the dealers consistently net short, a close study of the changes in the dealers net short position reveals they largely escaped loss by virtue of trading against the tech funds. (The long-term rise in gold had more to do with the cessation and reversal of the idiotic and manipulation practice of metal leasing/forward selling.)
The dealers’ trading success (or at least escape from financial damage) has occurred in spite of the funds holding enormous open profits in gold and silver at times, measuring in the hundreds of millions of dollars, only to lose such open profits in sudden price downdrafts. It is easy to prove my assertion. Go to the web site of what is considered to be the largest tech fund, John W. Henry & Co (www.jwh.com) and review the lack of profits in their metals’ trading, in spite of robust gains in metals’ prices these past few years. I’m not saying the tech funds have lost big, but rather that they have let big open profits disappear on several occasions and have nothing to show for all their massive metals trading.
Since the lows in July, when the tech funds held a small long position and the dealers a small short position, the gold price has advanced roughly $50. That price advance was caused, according to my COT-interpretation, by the tech funds’ purchase, of more than 100,000 COMEX gold futures contracts (the equivalent of 10 million oz). Perhaps I am over-simplifying things, but it seems clear to me that this 100,000-contract tech fund purchase is precisely why the gold price rose $50. I say this knowing full well that many other reasons for gold’s rise have been given.
It is this 100,000 contract increase in the tech fund gold long position and dealer short position that creates the risk to the downside, as it could be expected that the tech funds will sell these contracts at lower prices. It is important to state that I don’t know if this will happen, just that it has always ended with tech fund liquidation when the position has been this extreme. Maybe it will play out differently this time. To be sure, the resolution of this extreme market structure, one way or the other, will be precisely what determines the next short term move in gold prices.
My point is simple – the $50 gold price increase came because the tech funds bought 100,000 COMEX contracts, and the price will move from here, up or down, depending upon who blinks at this point; the funds, as is usually the case, or the dealers being overrun for the first time. I don’t claim to know how this will play out and neither does anyone else, but I do know what will determine the outcome. That paper speculators, funds and dealers alike, and not legitimate real metal participants, are clearly setting prices is against basic commodity law.
In silver, there was also deterioration in the market structure, by close to 20,000 contracts (100 million oz). While the silver COTs are nowhere near the historical bearish extreme of gold, it does give one pause for thought on a near term speculative basis, especially considering that extreme gold reading. (Long-term core silver positions and the COTs, like oil and water, don’t mix. The real silver fundamentals are better than ever). But the willingness of the dealers to sell and let the tech funds "off the hook" by 20,000 net contracts does negate a recent speculation of mine that the dealers may be unable or afraid to sell short silver in size and that the big move was imminent because of that. Obviously, I was wrong, even though we did rally by 80 cents, trough to peak, in the past couple of months. Eighty cents was not my idea of the big one.
But I am still struck by something that is nagging at me. While the dealers did sell roughly 20,000 contracts on the so-far modest silver rally this time, my sense is that they are still reluctant to sell short the massive quantities they have sold regularly in the past. There have been times in the recent past when the dealers’ net short position would be as much as 30 to 40 thousand contracts larger than it is currently, or the equivalent of 150 to 250 million ounces more than now. As recently as early June, the dealers held a large 77,000-contract net short silver futures position on the COMEX. In the past two months, however, the largest net short position has been in the 54,000-contract level, both in early August and in the latest COT Report.
Why this seems strange to me is that gold has hit record large dealer short positions in the past two months, which caused the unprecedented extreme between the very high dealer short position in gold and the very small dealer short position in silver. One interpretation of this dichotomy is that the dealers were eager to sell gold short into the tech fund buying over the past few months, sensing they could cause tech fund liquidation eventually, but were very reluctant to sell silver short at all (at least until the two-day 40 cent rally incorporated in the most recent COT.)
Maybe I’m imagining something that isn’t there, and if silver continues to rally and the dealers do buildup to the large short positions they have held in the past, then my imagination was, admittedly, misguided. But if we turn down from current price levels and the dealers buy back the 20,000 contracts of silver they have recently sold, then that next bottom would take on particular significance.
I admit to disappointment that this last rally in silver didn’t explode violently from day one. It could have easily done so, considering the small net short position of the dealers and the large tech fund short commitment. Who knows, it still may. I certainly like it better when the COTs are flashing strong buy signals to compliment the spectacular silver fundamentals. Still, the COTs were and are, once again, in conformance with the price action that transpired in both gold and silver As such, it is hard to disregard the message, at least until that message is wrong. Kind of like a child learning quickly not to touch a hot stove.
As I have written previously, the COTs are not the be-all and end-all in the markets. They were never intended to be. Long-term investors should generally ignore them. Never should anyone dispose of a long term silver position because of a COT reading and never be naked short silver under any circumstances. But the COTs do have their use, particularly for speculative purposes. In my opinion, they have yet to be dead wrong at important market tops and bottoms. That’s not to say they can’t or won’t be wrong, just that I haven’t seen that yet.
There’s something else about the COTs that bears mention. They provide both buy and warning signals on a recurring basis. As simple as that sounds, any alternative guide that doesn’t regularly provide both signals tends to become little more than a feel-good cheerleading device. I don’t need anything to make me more bullish on silver. And it’s OK for the fundamentals to constantly give strong reasons to buy an undervalued asset like silver (until it is no longer undervalued), but it would be useless to further rely on a non-fundamental guide that never issued possible warnings on a short to intermediate term basis. The COTs may not tell you what you always want to hear, but they just might tell you what you need to know.-- Posted 28 September, 2005
FNM TUMBLES $4 Billion market value wiped out!
WASHINGTON, Sept 28 (Reuters) - Shares in Fannie Mae plunged on Wednesday after a report saying regulators found new accounting violations at the mortgage finance enterprise, which is already under scrutiny for bookkeeping distortions.
A spokeswoman for the Office of Federal Housing Enterprise Oversight, which oversees Fannie Mae's financial soundness, would not confirm or deny on Wednesday a Dow Jones report that the regulator has found extensive additional problems.
"We have an ongoing examination and I have no comment," said Corinne Russell, a spokeswoman for the Office of Federal Housing Enterprise Oversight.
Fannie Mae (FNM.N: Quote, Profile, Research) shares tumbled following the story, which said investigators discovered evidence executives overvalued assets, underreported credit losses, and misused tax credits. The article cited unnamed sources close to, or who have been involved in, the inquiries.
Fannie Mae stock had been down less than 1 percent before the article was published at about 1320 EDT (1720 GMT), but moved quickly lower. By 1540 EDT (1940 GMT), shares were down more than 9.6 percent in their biggest one-day drop since the market crash of October 1987.
The drop wiped out more than $4 billion of the stock's market value.
Fannie shares were exerting the most negative pressure of any stock in the Standard & Poor's 500 index, although the benchmark index remained modestly higher for the day.
OFHEO is reviewing Fannie Mae's books after accusing the company of misapplying accounting rules. Fannie Mae acknowledged accounting problems, ousted top executives and said it would restate earnings.
Fannie Mae officials were not immediately available for comment.
The LONG and SHORT of IT
Fannie Mae's retained portfolio shrinks in August
Wed Sep 28, 2005 09:31 AM ET NEW YORK, Sept 28 (Reuters) - Fannie Mae (FNM.N: Quote, Profile, Research) , the largest U.S. home funding company, said on Wednesday its mortgage portfolio slumped by an annualized 27.1 percent in August, to $768.3 billion, its tenth consecutive monthly decline.
That followed a 25.3 percent decline in July.
The Washington-based company's average duration gap, a measure of its interest rate risk exposure, was at zero months in August versus plus one month in July. This gauges the difference between the duration of assets and liabilities in the company's mortgage portfolio.
**FNM close on the lows down near $4!!
Infrastructure in Gulf is worse off than reported, we are near an energy crisis with winter approaching.
Demand may wane as reported over supply of gasoline doesn't jive with lack of OIL, economy is slowing.
The market follows Consumer Sentiment more X than not, consumer sentiment has plummeted, market upside breadth has dissapeared, new lows AGAIN above 100, market tries to rally and fades in PM, not a bullish picture, IMHO
OK, no we havent seen a collapse, but when buying power is near non existant, sellers could easily swamp bids in right scenario.
What is catching a bid? XTO FDG XOM NEM energies and commodities.
All this happening going into weakest period for markets.
VIX shows little fear, and we wobble within trading range. It certainly feels to me we have seen the best it can be, and if you see the Dow go down to test 10K again? you might find what the other end of spectrum has in store.
Duratek
Tuesday, September 27, 2005
FINITE RESOURCES
IMHO the eventual ROCKET SHOT of gold could come down to the correctness, and or realization of MASSES, lemmings and all that there are FINITE resources of what we hold dear.
WE can turn toilet paper into paper currency, but at some point ALL commodities are in FINITE amounts, and that includes gold and silver.
BUT, too many playa's, it is only seen as hedge against inflation, REAL MONEY, a vehicle to trade, something jewelry is made out of and body piercings. (gold tooth market too)
Water is precious but what isn’t polluted. Maybe our fields have finite ability to produce food.
But once you dig it up, the metals, it doesn’t disappear, but as money is old as our planet. THAT will never change. Asking the HERD of lemmings to hop on at end of ride so you can sell out, maybe has only happened once (in the 70's) WE DON’T have THAT kind of INFLATION NOW, nor is it likely, GOLD now is a DEBT HEDGE Not an inflation hedge IMHO
To make trade easier, paper currency was invented, it was TOO hard to roll the stone wheel for a goat, or break an ounce of gold for sexual favor, and the scales back then weren’t too reliable....the world needs paper, but one that has FINITE AMOUNT NOT at will produced.
It's all a game, not much bartering for skills going on, life is more a game now. Who can collect a bigger piece of pie, what is accepted as tradable. It could be broken Roman glass....if we all agreed.
The US is LOSING the game first to Arabs for oil, now again and to ASIANS for manufacturing, and our GOV thinks the printing of worthless paper to trade will continuer to be accepted? WHEN IT ISN'T, when THEY realize they don't like that game, we are sunk.
BUT, can you take gold to buy bread? To buy land? To buy stuff at WMT? For shoes?. NO, BAGS of the glittering stuff can be stored away for insurance....it may be easy to buy, how easy to sell?
So a lot of you and I as well will buy shares of the mines, or ETF (CEF etc) but at some point gains will be cashed in for?....PAPER ??? COUNTRIES MAY EXCHANGE GOLD, individuals will not....they won't allow it, the system would DIE.
WHATEVER THE VALUE of ass wiping fiat, it will ALWAYS readily purchase something, and in REAL INFLATION what you hold today won't buy tomorrow, is true for many things, as other things fall in price. A WORLD competitive stage and over capacity do not breed RUNAWAY inflation, the FED has bred another kind....who knows maybe as deadly, but not the kind that causes $850 gold IMHO.
A destruction of capacity or demand which outstrips it with TOO MANY $$$$$ would cause prices to skyrocket, and we aren’t talking about the kind SPECULATION breeds.
NO my friends, we live in a world in DEBT 2nd largest economy Japan is swamped with it, we are right behind them. CONSUMERS have LESS money to spend as wages have not grown, and so living the life of Rieley is done with PLASTIC. A Trojan horse and panacea.
ALL this stuff going on Katrina, IRAQ etc, and that is just when the $$ decided to rally. Its ultimate fate we all know is down the tubes, but not just yet.
If PEAK OIL or OIL Crisis gets in full bloom, MORE attention will go to....FINITE RESOURCES, and they will soar...could be tomorrow, could be months or years...it will come.......and gold's catapult will go hand in hand with that event IMHO.
Think of what caused the 70's inflation, and you won't see it now.
What we are headed to is a debt implosion of worldly proportions, there is no more, or should I say being able to run away from it, sweep it under the rug is running out.......the day of reckoning will cause ripples throughout the modern world. OH and the Chinese, their banking system is worse off than Japan's at its worst. Maybe 50% of loans uncollectible.
OUR data from BLS and our GDP purposefully manipulated and fraudulently presented. CPI and PPI all of it a total fabrication.
And we just go from asset inflation to asset inflation and the world's real problems go unaddressed as NO BID CONTRACTS get handed out to BUSH INSIDERS.
It's a mixed up bungled up world except for Lola!
RECORD debt and credit expansion has never seen the likes of what we now have, so far surpassing existing historic data to be unbelievable.
With savings at NEGATIVE values, with a world used to pay me tomorrow, I pray hell to pay just a tired cliché', but I would prepare just in case.
And as cycles go, we will survive and endure and maybe it will take us another 60 years to forget how we got into this mess before it happens again.
Its easy to think I got mine, but with a lot of have not's growing, it will be hard to side step.
KNOWING a simple MANDATE which was VETO'D by Bush to INCREASE MPG if instituted even 5 years ago of just a FEW MPG more per fleet, could have averted our present crisis of consumption. VYING for oil is also the stuff wars are made of, as our $$ go to outfit the Chinese military.
I said it and again, what we saw in 1980 is upside down on its head now. The Bear Market is lurking, and when it returns, it's going to get ugly.
Duratek
DATA SOUR
http://www.briefing.com/Silver/Calendars/EconomicCalendar.htm
Consumer Confidence and New Home Sales PLUMMET
Consumer Confidence Plummets in SeptemberTue 10:11AM ET - APConsumer confidence plummeted almost 19 points in September, its biggest drop in 15 years, as Americans worried about the economic fallout of Hurricane Katrina and rising gasoline prices.
·
New Home Sales Fall Sharply in August AP
PEAK OIL?
There is much talk about PEAK OIL and the fact that we are already there or a few years away from the "peak" in oil production but at same time we have RISING demand!!!! mainly from CHina/Asia which is only going to intensify. See links below and begin your journey to understanding this important global issue. IS THERE A FINITE (of course) supply of oil and if so, what can we do about it?
ONE article I read said we have already gone thru 1/2 of all known oil, and in 20 years or so there wil be NO MORE OIL!? A horrid thought, how so do we then run our industrial complex, move people from place to place, cool or heat our homes?
IMHO, world governments should move IMMEDIATELY and mandate much greater fuel efficiency from the car makers and a faster adaption of hybrid technology. I feel Fuel Cells using current technology is not feasible as it takes 4X more energy to produce the hydrogen as it must be extracted from the source, wind electrolysis is one technology being worked on.
http://www.peakoil.org/ more stories and links you could shake a stick at.
HUBBERT PEAK OIL THEORY http://www.hubbertpeak.com/summary.htm VERY detailed description.
And so the argument grows, as we argue and disagree about global warming and such, it is more likely peak oil is not a fantasy and more likely a reality which will change our world forever.
If oil corrects as most things go, it might make sense to consider , if you do not already have oil in your portfolio, there are ETF'S like XLE or energy and commodity mutual funds, this is a long term core holding IMHO
If you believe in alternative energy, PWB is a clean energy fund investing in all kinds of technology.
Utility companies pay a dividend, short term they might be suspect to decline if the yield on the 10 yr treasury rises above their avg yields now below 5%. COMPOUNDING (a favorite Russell suggestion) will help you avoid mistiming and increase your returns.
As Richard Russell of Dow Theory Letters suggested the last 20 years or so we saw asset inflation of paper assets, it isnt hard to fathom that maybe the next 20 years or so could be part of commodity bull market as they are seen as non renewable and in diminishing supply.
Alternatives like wind and nuclear power will surely be looking more attractive further down the road. Many power plants now use either COAL or natural GAS to convert to electricity, it makes sense to begin planning new nuclear power plants BEFORE we REALLY need them to take some strain off world supplies, maybe why URANIUM appears to be in a bull market!
Duratek
Duratek
ARGUMENT FOR OIL
Oil bubble set to burst?Some analysts say prices could now retreat after industry dodges severe damage from Rita.September 26, 2005: 2:52 PM EDT By Chris Isidore, CNN/Money senior writer
NEW YORK (CNN/Money) - Could the recent spike in oil prices have created a bubble that's about to burst?
With Hurricane Rita causing less damage than originally feared to the oil industry and oil prices treading water Monday, some industry analysts said we may be about to watch a steady, and significant, drop in energy prices.
"Price declines could be slow this week, maybe with a bubble burst at some point in the future," said analyst Peter Beutel, president of Cameron Hanover. "It does appear we've turned the corner here in this market. I don't think we'll see prices at these levels again anytime in the next five years."
Oil prices sank early Monday as traders reacted to reports that damage to the industry's facilities was limited, but turned higher as the market more fully assessed expected disruptions from Rita.
But prices are still well below levels reached last week when Rita was bearing down on the Houston-Galveston area, and Beutel and some other analysts were worried about a new price spike pushing gasoline to $5 a gallon.
Crude oil traded above $68 last Wednesday, about two days before the storm made landfall, and not far from the trading high above $70 after Katrina hit the Gulf Coast last month.
But before you start cheering Beutel's prediction, understand that part of his forecast is based on the belief that oil is high enough now to spark a global recession, which will significantly cut demand. He also believes that recent oil price records have spurred plans to increase global oil production, which he sees feeding the decline in oil prices.
Beutel sees oil prices falling all the way to the $25 to $35 a barrel range in late 2006 or 2007. Most other analysts aren't willing to follow that forecast, although some agree there could be a pullback in prices, even without a recession, if consumers start to have some breaks go their way.
"I think if the rest of the hurricane season doesn't cause disruptions, and global supplies stay as they are, we should see prices pulling back into in the low to mid-$50's, without a recession," said Sheraz Mian, oil analyst for Zacks Investment Research. "We could be in the high $40's if it's a warm winter."
Some see no bubble
But some analysts don't see any significant fall in the price of oil in the foreseeable future.
They say that the extent of damage to oil platforms and refineries from Hurricane Rita may well be greater than initial optimistic estimates suggest and that global demand is strong enough, and global supplies tight enough, to keep prices high.
"I would say we'll probably see $70 (a barrel) again before we see $50 or $55 even," said Oppenheimer & Co. oil analyst Fadel Gheit. "When the dust settles, we'll see that while Rita did not match Katrina in terms of impact, it significantly exceeded what's been reported."
Oil economist A. F. Alhajji, professor at Ohio Northern University, agreed that there's not much of a bubble now, noting strong global demand will keep prices high without a recession cutting sharply into demand.
"Inventories, which include commercial stocks and strategic stocks, are going to be at their lowest levels in history very soon," he predicted. "OPEC is selling the last bit of oil they can sell. We have no choice but to see higher prices sustained for a while."
And more oil shocks could lie ahead as the damage from both Katrina and Rita become better known, Alhajji said. He pointed to a year ago, when prices surged to what were then record highs about a month after Hurricane Ivan hit the Gulf of Mexico as production recovered more slowly than had been expected.
He worries what will happen when oil companies miss targets to resume normal operations at oil platforms or refineries affected by the most recent storms.
"Those delays are what will cause the increases," he said.
Gasoline prices expected to fall
But Alhajji does see some good news for consumers, as he believes that gas prices are about 30 cents a gallon above where they would be in relation to oil prices due to refinery disruptions. And he believes that rising imports are serving to close that gap, so that there could be some more relief at the pump even if oil prices edge higher.
"Unless we have another hurricane, it may be that gasoline prices have no where to go but down," said Alhajji.
There are seven refineries near the Texas-Louisiana border that took the full brunt of Hurricane Rita, and there was still standing water in and around many of those facilities Monday.
With about 1.7 million barrels of daily capacity, those plants refine about 10 percent of the nation's oil, or about twice as much capacity as the four refineries still off line after Hurricane Katrina.
That kind of disruption could normally drive oil prices higher, but damage was seen as less than what might have been if Rita had hit the Galveston-Houston area, home to 2.3 million barrels a day of refining capacity.
Gheit said he believes the oil industry is consciously trying to put the best face possible on the damage from Rita in a bid to keep gas prices in check and reduce political pressure that can come with high gasoline prices.
"There have been serious discussions by politicians from both parties about pushing for windfall profit tax," said Gheit. "That's what has the industry terrified."
Monday, September 26, 2005
BOOM P.O.D.
http://www.payableondeath.com/media/index.php
Use real player option, my favs? youth of nation alive and boom!
It's what we do, take our best shot and its OK! reday or not, how do you like me now?
Duratek (yes I'm 50!)
Use real player option, my favs? youth of nation alive and boom!
It's what we do, take our best shot and its OK! reday or not, how do you like me now?
Duratek (yes I'm 50!)
CRACK PIPE ON FIRE !!
By Jeannine Aversa, AP Economics Writer
Most Homeowners Can Weather a Shock if Prices Drop, Greenspan Says
WASHINGTON (AP) -- While the high-flying housing market still holds risks, especially for the financially stretched, most homeowners are in a fairly good position to weather a shock if prices drop, Federal Reserve Chairman Alan Greenspan said Monday.
"The vast majority of homeowners have a sizable equity cushion with which to absorb a potential decline in house prices," he said in remarks delivered via satellite to a banking conference in Palm Desert, Calif. Less than 5 percent of home borrowers were highly leveraged, according to one measure, he said.
**Double talking fool, one side says LOOKOUT AMERICA TROUBLE AHEAD, and then someone pulls him aside and says "pssssssssstt Alan, can you uhm, tone it down"....we dont want to wake up the lemmings"
SO he comes back with.....nah dont worry forget what I Said yesterday, because you probably couldn't make sense out of it anyway , now there's some truth.
Today's action was a RELIEF RALLY? and a WEAK one IMHO with only 54% UP volume.
Duratek (you make it this far Joe and Sheila?)
MOGAMBO GURU BOND HUMOR
THE BONDS OF INTEREST
by The Mogambo Guru
It was very interesting to me to read the letters to the editor in Barron's this week. Five of the eight letters were in reference to the Barron's article by Alex J. Pollock, dated September 5, 2005 entitled, "Can You Afford To Retire?" It uses these long-term averages to calculate how much money you will need if you want to retire for 20 years after working 40 years. In short, you somehow amass enough money that two days of working will be able to finance one day of retirement.
The basis of his astonishing investment return calculation is that you will get, on average, a real, inflation-adjusted, yield in Treasury bonds of three percent. Hahahaha! Now you are starting to see why I initially dismissed the article! Inflation is now running, according to the just-released CPI report, at 3.6 percent! Ten-year T-bonds are yielding 4.27 percent! This is a real, inflation-adjusted, yield of 0.67 percent! And this has been going on for years already! So, the idea of bonds yielding, after inflation, an average 3 percent, Makes The Mogambo Laugh With Scorn And Contempt (MTMLWSAC).
But suppose that the long-term average yield on bonds really is a lofty three percent. Then that means that T-bonds, right now, should be yielding 6.6 percent. But, but, but, they are not yielding that! They are yielding a lot less than that. That means, to get back to the three percent real, inflation-adjusted, yield, bonds have to start not only yielding 6.6 percent, but also more than that! They have to yield more to make up for the last few years where you were making a lot less than three percent. Currently it's about 0.67 percent, and it has often been a lot less than that. If they don't, then the long-term, real yield would be less than three percent, which violates the constants we all stipulated to at the beginning. So, now we are talking about a nominal yield of eight to nine percent! Hahahaha! And not only that, but the guy makes no adjustment for the taxes you are going to pay on those capital gains when you sell the bond, the taxes on the interest, or as is the case in the real world, both.
I know that you are happy that you are suddenly making eight to nine percent, and you are doubly happy that we are ignoring taxes. Already I can see your mind working on how you are going to defraud the taxman. As an aside, let me advise you to never, ever cheat on your taxes, as the penalties they can levy on you will break your back, break your heart, and consume your whole life; as you think about it, fret about it, and have nightmares about it. You will worry about it every waking moment, and the few lousy dollars that you are ahead cannot possibly be worth it, especially after paying the lawyer, to try to keep you out of the slammer. The way to pay fewer taxes is at the ballot box; when you get rid of the big-spending morons you accidentally elected last time, because you showed up at the polls either stupid or drunk, or as in the case of The Mogambo, both. And if you are from Massachusetts...yes, I am especially talking about you.
But this is not about taxes, or why the halfwits we elected to Congress have made inflation so high with their socialist spending programs and entitlement programs that are now supporting a full third of all Americans. This is not even bringing up the horrid Federal Reserve, a secretive cartel of private banks who cleverly put the name "federal" in the name they chose to make people think that it is a government agency, but it ain't, even though their incredible stupidity makes them seem like a real government agency.
No, this is about what we professionals in the economics business call The Mogambo Big Freaking Point (MBFP): It all depends on where you are in the business cycle. Write this down in your notes. You will find it very instructive in the years to come. Here is my iron clad, unassailable reasoning. Today you are getting a real yield of about a half of a percent, right? So, to get back to a real yield, interest rates have to go to - and let's be conservative - eight percent.
But what happens if you buy a bond today, one that yields that real 0.67 percent that we were laughing about earlier? When interest rates rise to that long-term average of eight percent (which is, as we know, about double - double! - what today's ridiculously over-priced bonds are nominally yielding today), the market price of the bond that you are now so proudly holding will plummet to less than half what you paid for it! You will realize a loss...a big loss...a huge capital loss if you sell! Huge!
And if you don't sell the bond before maturity, you will be stuck with that damned silly, embarrassingly puny 4.27 percent yield, when everybody else is making eight percent, until the damn thing matures! I will leave it up to you to imagine how your career will fare, when every day at work people will laugh at you and say "Hahahaha! Mogambo is a big fat idiot who locked us into getting half-a-percent interest on our money for the next twenty years!"
The Mighty Extra-Sensory Mental Powers Of The Mogambo (MESMPOTM) are abuzz, meaning that I know what you are thinking. You are wondering, "Does any of this impress pretty girls or boards of directors?" Unless you are a woman, then you are thinking, "Does any of this impress hot hunks with tight buns or boards of directors?"
Let me tell you, from a guy that knows first-hand that boards of directors are not happy when you report that, through your own ignorance, stupidity and poor judgment, the firm's money is locked in for twenty long years, generating almost nothing in return. In fact, boards of directors are usually far beyond merely "unhappy." They are more toward the end of the spectrum where they summon security guards to clean out my desk, and they steal my stuff while they do it...important stuff...personal stuff, like that autographed photo of President Bush I had on my desk, where he has written, "I hate your guts, too! Now stop insulting me, you stupid little jerk."
I will not even comment on the stupidity of thinking that everybody can make money in the stock market. They can't. If everyone puts 10 dollars into a bucket, then it is impossible for everybody to take twenty dollars out of the bucket. Jeez! You would think it would be obvious!
Remember that part where I said that it all depends on where you are in the business cycle? Well, we are only talking about today. Stocks and bonds are a bad, bad idea today. There was a time when buying bonds was a really, really, good idea, and they were paying above their long-term, real, inflation-adjusted average! Then, when interest rates fell, as they inevitably do, the bonds went up in value! This ain't, in the vernacular, nowhere near that time no how.
And there was a time when buying stocks was a very, very good idea, too; back when the P/E ratio was below its long-term, real, inflation-adjusted, average, too. As with bonds, this ain't that time, either. This ain't, again, nowhere near that time, no how.
The sad truth is that inflation will destroy whatever little bit of money that you set aside, as it is currently destroying the little bit of money that you have been setting aside, especially for the last five years. The sad, sad truth is that you will need to save at least one day's pay for one day's retirement. In other words, you must save 100 percent of your income if you want to have enough money to offset the roaring inflation that we are going to have over the next decades!
So, how bad is inflation? Alert reader Mike S. sent me the table of inflation calculated by Freebuck.com, using the same components of the official consumer price index, but calculated by merely looking at the price of something in 1968, and then looking at what the item costs now. Both of the statistics have housing at 40 percent of the total market basket.
So, what is the bad news? Well, first off, the official government number is that annual inflation has averaged - and I hope you have a safety helmet on when you hear this - 4.71 percent since 1968! This is, in historical context, so horrifically bad that is ranks as one of the longest and worst episodes of inflationary misery in our history. After the paramedics have restarted your heart, tell them to stand by, because next you are going to learn that the Freebuck.com people show, and quite easily, too, that inflation is really running at 5.96 percent
That six percent inflation is, coincidentally, less than the real, wallet-busting, prices-you-pay type of inflation that is roaring right freaking now! Actually, true inflation is somewhere between seven percent and 11 percent, as far as I can tell, and I get that from looking at the checks I have to write every damned month. It is the worst in decades, judging by the number of tears that I shed while paying those bills.
Notice I said "decades," although you were probably distracted by watching the way little drops of spittle fly out of my mouth when I say it with such vehemence and how sparks of outrage are shooting out of my ears. So, I will repeat: You must save 100 percent of your income to stay ahead of inflation if you think you are going to work for 40 years and retire for 20.
Regards,
The Mogambo Guru
for The Daily Reckoning
DEBT LADEN ATLAS SHRUGGED
M2 - MR. Jones
By: John Mackenzie
There are limits to the seemingly endless parade of DEBT schemes and although U.S. debt has increased several fold since the mid 1990’s, the rest of the World has quietly begun removing support for the Dollar Debt. Capital flight began in early 1999 with large inflows into Eurobonds and has continued ever since.
The smart money bailed out years ago.
It’s easy to understand why.
Consumer spending has become THE economy and what the Government does not bother to tell you is something so egregious it’s almost beyond comprehension.
115,356,000 ‘Consumer Units’ (CU’s) are defined as households consisting of (a) occupants related by blood, marriage, adoption, or some other legal arrangement; (b) a single person living alone or sharing a household with others, but who is financially independent; or (c) two or more persons living together who share responsibility for at least 2 out of 3 major types of expenses—food, housing, and other expenses.
Students living in university-sponsored housing also are included in the sample as separate consumer units.
Of the 115,356,000 CU’s, the Federal Government can account for ~ 97,391,000 or approximately 84.4%.
Aggregate Reporting Income is neatly divided into quintiles (20% or one fifth) with CU’s per quintile @ ~ 19,500,000.
Stay with me here, don’t nod off, it’s about to get interesting and please remember: ‘Income’ is stated prior to taxation.
Given the average number of CU’s is 2.5, we will use ‘Head of Household’ for our filing status assumptions for simplicity.
For the lowest quintile or lowest 20%
Income before taxes $ 8,201
Average annual expenditures $18,492
Income Shortfall $10,291 or ~125%
Tax Owed $ 820
Tax Bracket 10%
Effective tax Rate 10%
________________
For the second quintile or 2nd 20%
Income before taxes $21,478
Average annual expenditures $26,729
Income Shortfall $ 5, 251 or ~24%
Tax Owed $ 2,699
Tax Bracket 15%
Effective tax Rate 12.57%
________________
For the third quintile or 3rd 20%
Income before taxes $37,542
Average annual expenditures $36,213
Income Surplus $ 1, 239 or ~3%
Tax Owed $ 5,109
Tax Bracket 15%
Effective tax Rate 13.61%
________________
For the fourth quintile or 4th 20%
Income before taxes $61,132
Average annual expenditures $50,468
Income Surplus $10,664 or ~17%
Tax Owed $ 10,780
Tax Bracket 25%
Effective tax Rate 17.63%
________________
For the fifth quintile or 5th 20%
Income before taxes $127,146
Average annual expenditures $81,731
Income Surplus $45,415 or ~36%
Tax Owed $28,014
Tax Bracket 28%
Effective tax Rate 22.03%
It is important to note that until we reach the top 20% of CU’s reported for 2003, surplus income does not exceed the Tax owed.
Of serious consideration is bottom 40% of the Consumer Units reported to be deeply underwater with respect to income versus expenditures, the ‘Great Society’ is ensnared in its own trap, the predominant Welfare State. A stratification spreading up the Income Ladder through Monetary Inflation.
The rate of new DEBT growth in CU’s is frankly mind boggling; the ratio of household debt to disposable income reached a record of 108.3 percent at the end of 2003 for the CU reporting period above.
We rely on Foreign Capital to elevate this debt bubble at extremely low real interest rates while eating out tax cut cake. The hidden tax of inflation is assuming enormous risks. The simple matter of invading capital stocks to replace the decline in savings has reached its zenith with the Real Estate / Housing.
There is a limit how much DEBT CU’s can pay to keep the economy from collapsing.
Collapse may sound overly dramatic, but the DEBT spending boom fed on Chairman Greenspan’s latest Bubble is rapidly going to need to contend with rising unemployment and a real economy that is simply folding up under its own weight.
No one appears to want our DEBT.
The Federal Reserve has few choices at this juncture; they can maintain their increasing moral hazard as the buyer of last resort, or they can allow the DEBT to consume itself through default.
We can no longer sustain US DEBT levels, although we will certainly attempt to, the American Way of Life is about to become a ‘negotiable’ instrument, it is best to wake up to this simple truth sooner than later.-- Posted Monday, 26 September 2005
Sunday, September 25, 2005
2 STORIES TO START YOUR WEEK

Greenspan gets frank
Regulators looking at hedge funds Hedge funds now manage an estimated $1 trillion in assets worldwide, and in some cases, a single fund can account for a big chunk of the volume on some exchanges. (For more on hedge funds, click here). *(they have doubled in 4 years)
THE LAST TO TOP?
 The last to top? As was the case in 2000? The MACD has yet to better that momentum and during this parabolic looking rise the MACD is moving sideways.
Maybe it's taking a breather? Been near 70 RSI overbought for nearly a year! As the hunt for yield was taking place.
Yield now much closer to 10 yr bond as most UTE yields below 5%.
Both 20 and 50 wk EMA'S of course look splendid, so we cant get ahead of ourselves just yet, until first the proce dips below these 2 SOLID supports and THEN the 20 breakds down thru the 50 and both begin a decline trajectory.
This would be further evidence the Bear Market has returned, and I wonder if a rising 10 yr yield will be what sets it off. Seems unlikely in a slowing economy, but there are other forces about.
Duratek
Saturday, September 24, 2005
VAlERO REFINERY UNDER WATER
One oil refinery reports 'significant damage' following Hurricane Rita
(CNN) -- Valero Energy reported Saturday that its recovery teams found "significant damage" to its oil refinery in Port Arthur, Texas following Hurricane Rita. (Posted 3:53 p. m.)
Valero Energy Corp. said it will take two weeks to a month to repair and restart its 255,000-barrel-per-day Port Arthur refinery, which sustained "significant damage to two cooling towers and a flare stack."
BIRDS OF A FEATHER
Japan's market may be rallying, but it is as they take the lead of most indebted nation? Shakey ground. Easy credit puts China near top of list waiting for an accident, possibly their banking system is in worse condition than Japan's.
EARLY comments on China:
Posted on 01/16/2003 8:06:25 PM PST by maui_hawaii (freerepublic.com)
SHANGHAI, Jan 16 (Reuters) - Chinese economists are engaged in a rare, frank debate over whether China's debt-laden banks are on the verge of collapse, just before a new generation of top financial officials gather to set the policy agenda for the year.
Even though Western analysts have lambasted China's creaky banks for years -- estimating 50 percent of all loans were bad due to years of policy-driven lending to state companies .
China’s four major state commercial banks—Bank of China, China Construction Bank, Industrial and Commercial Bank of China and Agricultural Bank of China, have long carried huge amounts of bad loans, which can never be recovered.
V. Stock Market
The Chinese people have invested as much as 2.45 trillion yuan (about US$302 billion) in China’s stock market, but where is the money is now? Some major investors have earned over 600 billion yuan (US$74 billion); the national stamp tax revenue has reached over 210 billion yuan (US$26 billion); brokers have made more than 210 billion yuan (US$26 billion); market makers and institutions gained over 200 billion yuan (US$25 billion); employee share options, transfer right shares (TRS) and other parties gained some 280 billion yuan (US$35 billion); earnings of premiums on options of new shares amounted to some 100 billion yuan (US$12 billion); listed companies took over 850 billion yuan (US$104 billion).
As a result, the dividends for the ordinary shareholders were only about 60 billion yuan (US$7 billion). In other words, tens of millions of ordinary shareholders spent 2,450 billion yuan (US$302 billion) purchasing 202.5 billion “non-tradable” shares. However, the book value of all these listed companies’ assets is only about 450 billion yuan (US$55 billion). This is the real situation of the Chinese stock market, and the risk in the stock market is very likely to ripple into the banking system as a whole [20].
In addition, a survey conducted by Sina.com on 25,675 shareholders dated March 30, 2005, revealed that 94.28 percent of the shareholders suffered financial losses. Among them, 67.34 percent of them lost more than 50 percent [22].
A report actually stated, “The actual goal of China’s stock market is not to bring financial profits to its investors, but to raise revenue. Whom is the money collected for? The answer is: for those enterprises that operate in the red, and for the Chinese government.” [23]
On June 2, 2005, the Shanghai Stock Exchange index plunged to 1,008.75, and was on the verge of dropping below the 1,000 mark. China’s stock market was on the brink of collapse, which the Chinese Communist Party (CCP) has been reluctant to admit publicly. The Chinese Communist regime ordered the implementation of a measure called “safeguarding (the stock market) with a policy” — The government invested 66 billion yuan (US$8 billion) of public funds to bail out the market. As a result, the market index recovered temporarily and the collapse was averted. However, the problem was simply delayed and would expand into the monetary sector. The CCP would be confronted with an even more desperate collapse if the stock market falls after all. The problem won’t disappear.
D
DEBT RELIEF FOR POOR NATIONS
WASHINGTON - A deal to erase billions (about $40B) of dollars of debt for poor countries gained momentum on Saturday, with supporters predicting quick approval by the
The United States and seven other major industrial powers made firm pledges to underwrite the plan, a commitment intended to overcome the biggest obstacle to approval by the lending institutions.
**And you thought this was going to be about the US?
D
The United States and seven other major industrial powers made firm pledges to underwrite the plan, a commitment intended to overcome the biggest obstacle to approval by the lending institutions.
**And you thought this was going to be about the US?
D

Friday, September 23, 2005
CAT 3 RELIEF
When Cat 5 went to Cat 4 the market boogied, but when Cat 4 went to Cat 3 the market went flat! Oh well.
Another day where new LOWS outnumbered new highs. Some CHinese names getting played now. from yhoo
3:18PM New 52-Week Highs :There are not a lot of new 52-week highs today, but some Chinese tech names are breaking through. Tallies so far today for new highs vs lows are 77-120 (NYSE) and 95-91 (Nasdaq)... Sectors with good representation on the new high list today include Chinese Tech/Internet (KONG, LTON, TOMO), Biotech/Pharma (BCRX, CBST, POZN, XNPT), Software (LPSN, WSSI), Semis (SIMO, SMSC), Oil & Gas (AEZ, APL, DBLE), Other Large Caps (GD, LEH, RIO, UNH).
That's it. STAY safe Texas, it looks like maybe we dodged one here.
Duratek
Are these pictures worth a 1K words?
 I believe when the 20WK of this ratio turns down through the 50WK in earnest, we can stick a nail in the cyclical bull market. As you can see it correctly called the beginning of this cyclical bull it is then good enough to help us see the end of it along with our other tools.
 ABove you can see the10 yr Treasury chart, andno wonder it has been hard to figure out where it is going. SInce 2004 the 20 and 50 wk have danced with each other converging but hasn't yet tipped its hand.MACD is trying to turn up from below zero, usually a bullish occurance (for this measure we mean higher rates) Just my humble observance.
Duratek
JOIN "Our" (P1 M1 and M2) FIAT/GOLD reasoning
> Would be miracle to most if dollar its anywhere NEAR 100.00 (dollar index) as EWT
> suggested.
>
> EVEN over 90.00 it could cause a short covering domino effect, helping
> $$ we know many short
>
> AT anywhere near 100.00 the majority would have shifted to the $'s
> soundness, all the while the f'ers been printing a HEAP MORE. RISE in
> $$ punishes GOLD.
>
> FROM TOP of $$ retrace, is where we want to have a heap of gold, and
> bullishness for the metal has dissapeared
DID YOU KNOW?
Japan's National Debt Hits Record High *(associated Press)
Japan's government debt, already the highest in the industrialized world, rose 1.7 percent to a record high of 795.8 trillion yen ($7.1 trillion) at the end of June, according to a report released by the Finance Ministry.
The latest figure marked an increase of 14.3 trillion yen from the end of March , the ministry said Thursday. The amount is equivalent to about 6.24 million yen ($55,900) for every Japanese.
Japan has relied on government bond issues to make up for falling tax revenues, turning into one of the world's most indebted countries.
Japan's public debt burden is almost 160 percent of its GDP and already the highest in the industrialized world.
Prime Minister Junichiro Koizumi, voted back to office following a landslide win in the Sept. 11 lower house elections, has pledged to improve the country's finances by reining in public spending and creating a smaller government.
A package of bills that would privatize Japan's massive postal service, set to be approved during a special parliamentary session that began Wednesday, has been the cornerstone of Koizumi's reform agenda.
Advisers to the government have also been mulling ways to raise taxes when the nation's economic recovery takes firmer root.
Thursday, September 22, 2005
ALCOA as PROXY?
Alcoa warns on 3Q earningsTop aluminum producer says earnings could be 39% below estimates on higher energy costs.
September 22, 2005: 5:21 PM EDT
NEW YORK (Reuters) - Alcoa, the world's largest aluminum producer, warned Thursday that its third-quarter earnings would be as much as 39 percent below Wall Street estimates on lower aluminum prices and higher energy and raw-material costs.
Alcoa (down $0.18 to $25.90, Research) shares were halted in after-hours trading Thursday after closing down 18 cents at $25.90 on the New York Stock Exchange. The stock sank more than 5 percent once after-hours electronic trading was resumed.
Alcoa also cited weakness in automotive markets and in Europe in its new forecast for earnings per share from continuing operations of 27 cents to 31 cents. Analysts polled by Reuters Estimates had expected earnings per share of 44 cents on average.
"All these companies are getting hit by (natural) gas. The problem is we know what they are getting hit by but it's impossible to put a number on because you don't know what their hedges are," said analyst Charles Bradford of Bradford Research/Soleil Securities.
Natural gas futures have climbed about 86 percent during the third quarter, driven in part by production cuts due to Hurricane Katrina and the soon-to-strike Hurricane Rita.
"I know the numbers are going to be bad for all of these guys," Bradford said, referring to competitors in the aluminum business as well as steel companies, all of whom carry significant energy costs.
Alcoa said aluminum prices on the London Metal Exchange fell during the quarter, and said recent strength in metal prices will not be reflected until the fourth quarter.
Alcoa also said it did not yet know what the impact would be from the closure of an alumina refinery in Texas and an anode plant in Louisiana due to Hurricane Rita. Any impact, Alcoa said, would be reflected in third-quarter results.
------------------
The economy was losing steam before Katrina. Click here for more. (as I suggested)
D
SEPT RICHEBACHER SNIPPET
THE FED'S WILD IMAGINATION (gold321.com)
Kurt Richebächer
In his testimony to Congress on July 20, 2005, Mr. Greenspan declared it quite likely that the world is currently experiencing a global savings glut. Agreeing with Ben Bernanke, he mentioned this glut as one of the factors behind the so-called interest conundrum, i.e., declining long-term rates despite rising short-term rates.
Having read a lot from the Fed's luminaries, their inability to distinguish between rampant global credit excess and a global savings glut does not surprise us. In this view, the Federal Reserve has come to the rescue of a world where excessive saving is threatening depression by eliminating savings.
Attracted by superior rates of return on U.S. assets, investors around the world have been scrambling to pour their excessive savings into direct investments, stocks, bonds and real estate in the United States, in this way financing the resulting huge U.S. trade deficit.
While this explanation may seem to make sense, there is one big snag: Not one word of it is true. First of all, in reality, private foreign investors have drastically curbed their investments in the United States. According to the Bank for International Settlement - the international organization of the world's central banks - Asian central banks financed 75% of the U.S. current account deficit in 2004.
First, private capital flows into the United States have slumped. Without the massive interventions by the Asian central banks, the dollar would have collapsed long ago.
Second, the dollars with which these central banks have been buying U.S. Treasury and agency bonds have definitely nothing to do with Asian savings. Evidently, the central banks are recycling the dollars, no more, no less, which they receive from U.S. trade and capital flows. These dollars have come into the central banks' possession through their interventions in the currency markets, to prevent a rise of their currencies against the dollar.
To speak of a global savings glut as a possible cause of the surprisingly low U.S. long rates in the face of these blatant facts is truly the height of insolence and absurdity. That this opinion comes from the leading figures of the Federal Reserve is more than shocking.
True, Asian countries have very high savings rates. For China, it is reported to be as high as 45% of disposable income. But this does not necessarily imply an existing savings surplus be lent to America. The bulk of available savings in China domestically is locked up in an even higher domestic investment ratio.
Looking at the global financial system, a straightforward fact to see is that central banks have been amassing foreign exchange reserves at an accelerating pace since the early 1970s. Rising in several large waves, their main source is plainly the soaring U.S. trade deficits.
Having no use for dollars in general, the first dollar recipients in the surplus countries sell them to their banks against their own currencies. These banks, in turn, found ready dollar buyers in firms and investors around the world, wanting to acquire direct investments or other assets in the United States, at least until 2000. Since then, though, capital inflows on private accounts into the United States have drastically receded, while U.S. trade deficits have exploded. In order to prevent a rise of their currencies against the dollar, central banks had to step in as buyers of last resort.
Apparently, it is not widely realized that this big shift in dollar recycling from private accounts to central banks essentially has far-reaching monetary implications for the participating countries and even for the world economy and world financial markets. Buying dollars, the central banks credit the commercial banks in their country with interest-free deposits.
Now, the critical point to see is that the banks, on their part, regard these deposits as their liquid reserves to be used for profitable lending or investment. Inundated with liquid reserves by the dollar buying of their central bank, the commercial banks in these countries embark on faster credit expansion. Shifting the rising surplus of liquid reserves between them, they create credit for consumers, businesses and speculators many times the amount of the liquidity injection by the central banks.
Our focus in particular is on China. As in the United States, the resulting credit deluge is boosting components out of proportion to the whole economy. In China, however, the specific components are real estate and manufacturing investment, while in the United States, it is consumer-spending excess.
What the Asian central banks truly recycle is the U.S. credit excess. But in flooding their banking system through the dollar purchases with liquid reserves, they transplant the virus of credit excess to their own economies. For U.S. policymakers and economists, this is a reasonable and sustainable division of labor. The U.S. economy runs on wealth creation through asset inflation with a high rate of consumption, while China and Asia run on wealth creation through saving and investment with a high rate of investment.
We are fearful of this development, because it affects more or less all industrialized countries with high wage levels. In this way, overconsuming America is force-feeding the rapid mutation of China's backward economy into a first-class manufacturing power. When China's credit and investment boom started, in 2000-01, its central bank had foreign exchange reserves in the amount of $165.4 billion. Today, they exceed $700 billion.
We are wondering what is worse for the whole world, China's further rapid manufacturing growth or a disastrous hard landing. Observing the same monetary and economic follies as in the late 1980s in Japan, we consider the second possibility highly probable.
A persistent, sharp slowdown in China's imports strikes us as ominous. The general comforting explanation is inventory liquidation. But how to explain, then, the continuous oil and commodity boom? We suspect speculation far more than economic growth as the reason.
With all the talk about a savings glut, we feel obliged to make some remarks about the subject. First, please take another look at the Wicksell quote on the first page, stating, "The supply of real capital is limited by pure physical conditions, while the supply of money is in theory unlimited." "Supply of real capital" is actually a synonym for available savings.
At an international conference in 1953 about savings in the modern economy, with many heavyweights in economics in attendance, the famous former chief economist of the Fed E.A. Goldenweiser gave a rare precise definition of saving. He said: "Saving means the withdrawal of sufficient resources from the production of consumption and services to have enough for maintenance, expansion and improvement of the plant." Then, he complained, "that ever since Wesley Mitchell's Business Cycles there has been a tendency to concentrate too much on the monetary expression of economic developments, and it has become reactionary to think in physical terms."
From the macro perspective, "saving" provides the physical resources for the production of capital goods in that consumers abstain with part of their income from consumption. Of course, this also involves money flows, but saving's decisive distinguishing feature is the partial abstention from current consumption to make real resources available for the production of capital goods.
It is ludicrous, therefore, when American economists claim that rising asset prices, increasing consumption, should by counted as saving. When we read decades ago that Mr. Greenspan, long before he became Fed chairman, had expressed precisely this view, he was once and for all finished for us as a serious economist.
The world economy seems to be flooded with liquidity. But there are two diametrically different kinds of liquidity: earned liquidity and borrowed liquidity. The former comes from surplus income or savings; the latter comes from credit and debt creation.
In a country with virtually zero savings like the United States, any liquidity essentially arises from debt creation. This is really fake liquidity depending on permanent, prodigious borrowing facilities, presently the housing bubble. Once this bubble evaporates or bursts, the U.S. economy loses its chief liquidity source - with disastrous effects on asset prices.
The crucial question concerning the U.S. economy is whether it is slowing or accelerating. As explained in detail, we see a lot of fudge in the recent economic data. Our main critical consideration is that a self-sustaining recovery would absolutely require a strong rebound in business investment. But that is not in sight. On the other hand, the turnaround in the housing bubble is only a question of time. A fairly short time, we think.
The consensus expects that the U.S. economy has the "soft spot" behind it and will surprise positively. We expect shocking economic weakness. All asset prices, depending on carry trade, are in danger, including bonds.
Dr. Kurt Richebächer for The Daily Reckoning
RITA STORM TRACK
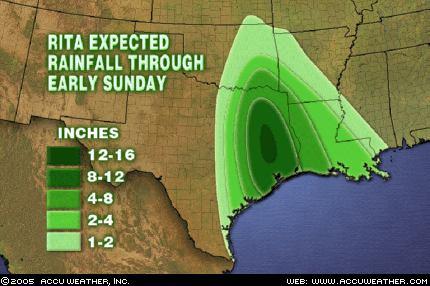
The strongest winds will occur from Friday night into Saturday morning, concentrated along and just inland from the northeastern Texas coast. In this area, winds of 120 to 150 mph with higher gusts are expected. Winds of this magnitude will cause catastrophic damage, on the order of what we saw in southern Mississippi where Katrina made landfall. Winds in downtown Houston are expected to reach 100-120 mph, especially in high-rise buildings and skyscrapers. Winds of this magnitude will cause many windows to break, with dangerous, flying debris all across the city. As the storm tracks inland, winds will blow to hurricane force for up to 150 miles inland right along the center's path, enough to cause widespread damage to trees and power lines along with some structural damage. So be prepared for a large portion of eastern Texas and western Louisiana to be without power for an extended time.
Torrential rain will also be a concern with Rita as it blasts ashore. A large portion of eastern Texas and western Louisiana should receive more than 4 inches of rain, enough to cause some flooding problems. There could be as much as 15 or 16 inches in some spots. Rainfall of this magnitude will cause significant flooding problems. So if you live in an area that is prone to flooding, be aware that you may be dealing with a potentially life-threatening situation as some point this weekend.
Story by AccuWeather.com meteorologist Gerald Mohler
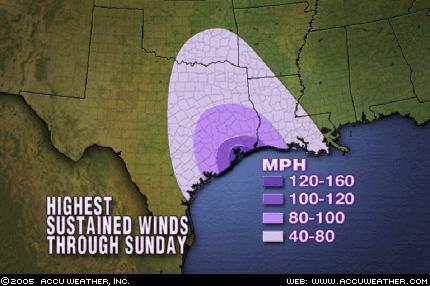
MY GOLD TA Observations
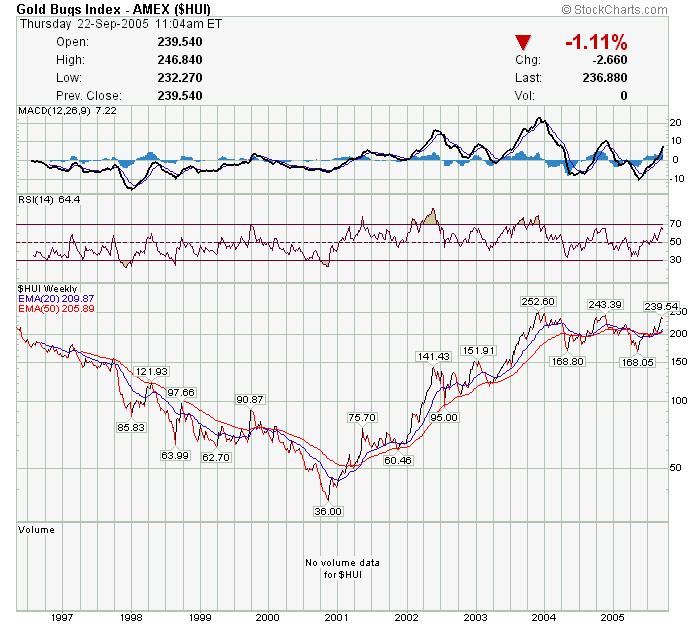
click to enlarge
Expensive services claim to have a "system" or wait until planets are aligned or they get a "signal".
Maybe something to them but don't you want to look impatiently at a play?
What we observe here in the HUI and I use WEEKLY chart because we want to smooth out the wrinkles and see the one larger trend.
BUY signal(20 thru 50) near 50, sell signal (weaker MACD) near 2nd top of $243 hows that?
Now we have the convergence of the 2 moving averages, so we must wait and see what happens.
High today gapped up to $475 and we are now at $466, puts in question parabolic pole move and we shall now see the rubber band snap, if gold is taking a breather or more. IMHO
Duratek
Some undajusted employment data
STATES WITH AN INCREASE OF MORE THAN 1,000
State
Change
State Supplied Comment
KY
+1,148
Layoffs in the manufacturing industry. An unspecified number of claims were Hurricane Katrina related.
TN
+1,416
Layoffs in the transportation equipment industry. An unspecified number of claims were Hurricane Katrina related.
AL
+2,719
Layoffs in the service industry. Most claims were Hurricane Katrina related.
TX
+3,506
Layoffs in the service, finance, and manufacturing industries. Most of the claims were Hurricane Katrina related.
GA
+3,782
Layoffs in the automobile industry. An unspecified number of claims were Hurricane Katrina related.
MS
+5,177
All claims were Hurricane Katrina related.
LA
+49,665
Most claims were Hurricane Katrina related.
THURSDAY IS HERE
Sony lays off 10,000, lowers estimates. Gold reaches new highs as Concensus Bullishness makes a near 9 yr high, moves looks parabolic.
Markets near 200 SMA support, so I would suspect a little bounce here as McClellan OSC is very oversold and 3 large down days in row bring large negative momentum on large volume.
Bonds continue to trade in a range, and is hard to determine where to next, economic weakness would seem to give lower yields the nod, but a guess in here with higher oil and such exerting inflationary pressures.
WMT makes a 6 yr low, is this reflective of the state of our most vulnerable consumers?
Unemloyment numbers will be discounted and blamed on Katrina, impossible to tell what else is going on.
I wonder to myself, look what has had its run, where is THE NEXT hot undiscovered thing?
WHat has run: financials, housing and related building materials etc, commodities (gold copper paper etc) retail, energy (oil, rigs, exploration etc tankers), small cap stocks, transportation (hit new high in 2005) and foreign stocks.
The thing most unloved and down in the mouth? SHORT FUNDS like URSA and RYVNX and the volatility index.
FACTOID of the DAY: WE JUST hit a record of bullishness 152 WKS straight of IIAA plurality of bulls (bulls - bears) orig set in 1998-2001 at 151 wks! AMAZING! LAST bear mkt which set up glorious 80's bull? followed a period in prior bear mkt of 40 plus weeks of BEARISH plurality, started at under 10 SPX PE, 6% DIV yield, 12% CASH in mutual funds and HIGH interest rates that could only come down. Americans HAD savings for nvestment.
Is why I say we have witnessed a strong cyclical bull that I feel is out of gas
Duratek
Wednesday, September 21, 2005
Category 5 Financial STorm
Fed says, "we're raising rates because this Katrina thing, just a passing bother, so what an entire city was wasted, million people displaced, will cost $200B + to rebuild.....hardly a scratch..." "American economy is strongest in the world" and I ask how so when we borrow to do anything and have a decimated manufacturing sector, so much so that Service Sector jobs are the economy and GDP is 75% Consumer Spending!
Now with historical neg .6% savings rate last report, with debt at historical levels never seen before, mutual fund cash near 3.7% another low (around 12% at normal BOTTOMS) and housing which IS the job grower the engine of economy been SPENT ouT!!!! topped out where to now? Look at shape of the BIG 3 Auto's GM saddled with $300B in debt and only $30 B in cash!
Higher energy managed to sink Consumer Sentiment to one of its lowest ever readings, remember our economy IS Consumer Spending, this winter heating bills could rise by 30% !!!!!
Now we have any even BIGGER storm heading RIGHT for the heart of our Texas refining industry, where 25% of all our refined products are made, and if you haven't prayed yet, for the people, for the platforms, for the refineries, I suggest you do so now, unless something changes and it might a direct hit is forcasted.
I just heard they build them to withstand Cat 3 storms...... 25% of our refinery capacity. WE GOT OIL, oil being bid up by speculators, is all it is IMHO we see the bottleneck is what they do with the oil to make gas etc that really matters, it has been DECADES since a new one has been built in the US, decades....environmental issues.
Now forget our fearless leaders not 20 not 10 not 5 or anytime could see straight to not just SAY we needed to get off the oil heroine, by RASING no damnit mandating higher fuel efficiency!!! NOT CLINTON and definately not good oil buddy BUSH, none of our Congressman could muster up enough fortitude to pass a bill that could have protected us from this outcome to some extent.
No, I remember the Bush tax cut, let you write off $50K plus vehicles, of which the expensive SUV'S fit right into that for businesses. GOOD IDEA!
Fuel Cells are a joke and panecea, it presently would take more energy and create more pollution to produce the hydrogen than just to burn the fossil fuel to begin with.
And GM, makers of the HUMMER gave one to their shareholders....Detroit decided to make the SUV a family tradition like apple pie....and they will pay.......while Toyota eats their lunch!
Now, the worst doesn't happen, a relief rally could appear, and maybe deserved, because do we really know why the market is weak?
Maybe its the Storm, but it was weak before that, where has it gone for the last year and a half? GOLD is flying yet consumption is DOWN and we have over capacity in manufacturing, except energy. Gold shares however lag badly the 18 yr highs in the metal as does Silver,so very odd indeed.
We know the demand for debt is HUGE, now add Katrina, yet....10 yr yields are still very low near 4.17% falling today. The money market has outperformed the stock market the last year and a half!
And while you take your risks, you get a paltry near record low 1.9% or so DIV YIELD on the SPX near 2.2% on Dow, bull market BOTTOMS are shown by HIGH yields near 6% and PE ratios near single digits.
Something is wrong, when history has not repeated yet Wall Street tells us SUPER BULL is here....some kind of bull is here.It PAYS to KNOW your history.
Sure, we will rebuild, but there was even a revolt if sorts today as Conservative Republicans held a press conference to decry THIS administartions fiscal irresponsability and they said ENOUGH IS ENOUGH. BUSH'S own party is demanding BUDGET cuts, and there goes the chance of MORE BUSH stimulus.
And we are running out of those options. And the debt heaped up so high there is no end, must be REPAID my friends, to those who LOANED us the money to have our drunken spending buffet, and some of these Republicans understand that and dont want the whole bill coming due to their children or grandchildren.
As it stands now, money is no object, and the 2 charts I showed earlier is the end result of that, over $1 Trillion fiat paper scraps injust last year alone.
TO me the growth in money supply defies any logic. The G-MAN has a few months to go, he wants to get out of town with is reputation, but somehow I feel history will none too kind to the world's greatest inflationist!
Its all coming together, and maybe it takes a Cat 5 Storm to make people understand, that you get nothing for nothing and something always comes at a price, and the good people of this country have been SOLD OUT by the wise guys and they don't even know it.
The slumbering Bear Market has been waiting, and there is a very good chance hibernation is over
Duratek
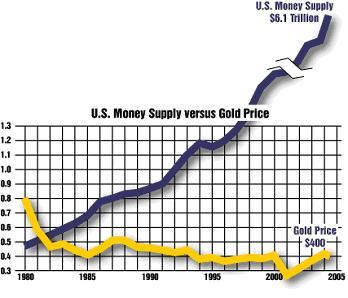
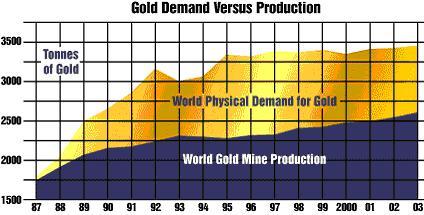
FACADE is Cracking

click to enlarge
GE is into EVERYTHING, and its sickly weak. Facade of economy andmarket is falling apart, or is it just another storm? or is it more like 2 posted articles a perfect financial storm? coming to our shores?
Greatest inflation of money supply and stimulus in history, lowest crisis rates in 45 years held LOW for 12 plus months, then agonizingly slid up .25 at a time to where we now sit at 3.75% fed rate.
LIVING proof as to what kind of shit we're in! New lows expanding by any measure closing in on 200, patient is sick.
Is ther enough JUICE left tis time to turn RR's PTI bearish? and keep it there.
Duratek
Katrina Tax Aid Fair?
Report: Hurricane Tax Aid Does More for Wealthier Survivors By Mary Dalrymple The Associated Press
Tuesday 20 September 2005
Washington - Tax breaks designed to help Hurricane Katrina victims get their hands on needed cash could do more for higher income survivors than for the neediest, a congressional report says.
The Congressional Research Service, an office that provides nonpartisan legislative analysis to lawmakers, pointed to several items in virtually identical bills that passed in the House and Senate last week.
One helps hurricane victims get access to their savings by waiving penalties imposed on taxpayers who tap into their retirement savings accounts before retirement. Others let taxpayers write off more of their destroyed property, and erase taxes regularly imposed when a debt, like a mortgage, is forgiven.
The report says lower income survivors are less likely to have retirement accounts like 401(k)s and IRAs to tap into for recovery. Because many lower income individuals and families pay little tax, assistance efforts that lower their taxes may do little good, the report said.
However, the same tax bills also include tax assistance specifically for lower income families that help the working poor hang onto their income tax credits, which can be disrupted by unemployment or family separation.
The provision lets those left unemployed or earning less because of Hurricane Katrina calculate their earned income tax credit based on income earned last year, allowing some families to claim a bigger credit. A similar calculation could be done for the child tax credit.
The House and Senate bills must be reconciled and signed by President Bush before becoming law.
Congress has started working on other fronts to help the poorest victims of Hurricane Katrina. Lawmakers sent the president a bill giving states immediate access to more welfare funds. Lawmakers have also discussed giving hurricane survivors access to Medicaid health care and making unemployment insurance funds more flexible.
Two Illinois Democrats, Sen. Barack Obama and Rep. Rahm Emanuel, suggested getting cash quickly into the hands of hurricane victims through an advance earned income credit payment.
Peter Orszag, a budget and tax policy expert at the Brookings Institution, said lawmakers would be better off directing aid through assistance programs like food stamps and unemployment insurance because they "are going to be better targeted to the severe cases of hardship."
ALERT
Market may be in early stages of FALLING APART! Reaction to FED isjow obvious, their shell game uncovered,and Katrina $200B debt will not come out of thin air.
Bush agenda destroyed, tax cuts extension SS etc on back burner, NO improvement in Iraq, now new storm way roil oil pipeline. No ONE talking problem with farm production. And think cost of gas bothers the farmer on his tractor? Or products shipped via any mode? Or anything that uses pertoleum (plastics)? Inflation is nascent? My ass it is.
BUT, we have OVERSUPPLY and capacity, so SET INFLATION definition does not apply.
COST of credit rising, more expensive, we need credit expansion to continue orwe get credit contraction and maybe the start of K-winter.
I think we are in a VERY FLUID situation with a shitpile of complacency, VIX up above 20 EMA tho
Duratek
Tuesday, September 20, 2005
MERGERS COST JOBS
http://biz.yahoo.com/ap/050920/federated_job_cuts.html?.v=6
Pssttttt, and we got FLAT after fun and games into the 2:15 twilight
D
Pssttttt, and we got FLAT after fun and games into the 2:15 twilight
D
Years of record sale squandered
Ford COO sees difficult time for industryTue Sep 20, 2005 10:26 AM ET
DETROIT (Reuters) - Ford Motor Co.'s chief operating officer on Tuesday declined to predict when the struggling automaker's North American operations would again be profitable, but said he sees difficult times for the whole industry in the next 18 to 24 months.
"I think the nature of competition in the marketplace is very, very challenging for all of us," Jim Padilla said at the Reuters Autos Summit in Detroit.
Strong competition, soaring health-care and raw material costs, and a slide in U.S marketshare has forced the second-largest U.S. automaker to slash its profit forecast twice this year. Ford's North American auto operations swung to a pretax loss of $1.21 billion, including charges, in the second quarter.
The automaker also said it would no longer provide a quarterly financial forecast, echoing a move by cross-town rival General Motors Corp.
The automaker has said it will announce a restructuring plan this fall and has not ruled out deeper job cuts in its salaried workforce or the closing of manufacturing plants.
This would be the second time that Ford will put together a financial turnaround plan. A multi-year restructuring program was launched in 2002, which included 35,000 job cuts, the shuttering about seven North American plants and the elimination of unprofitable vehicle models.
"I don't think it went wrong," Padilla said, referring to the 2002 plan. "None of us anticipated the aggressive pricing in the marketplace."
"When we put our plan together we assumed that incentives and the like would be in the range of 13 to 14 percent," he said. "Reality is that incentives has been 18 to 20 percent for the last several years."
DETROIT (Reuters) - Ford Motor Co.'s
"I think the nature of competition in the marketplace is very, very challenging for all of us," Jim Padilla said at the Reuters Autos Summit in Detroit.
Strong competition, soaring health-care and raw material costs, and a slide in U.S marketshare has forced the second-largest U.S. automaker to slash its profit forecast twice this year. Ford's North American auto operations swung to a pretax loss of $1.21 billion, including charges, in the second quarter.
The automaker also said it would no longer provide a quarterly financial forecast, echoing a move by cross-town rival General Motors Corp.
The automaker has said it will announce a restructuring plan this fall and has not ruled out deeper job cuts in its salaried workforce or the closing of manufacturing plants.
This would be the second time that Ford will put together a financial turnaround plan. A multi-year restructuring program was launched in 2002, which included 35,000 job cuts, the shuttering about seven North American plants and the elimination of unprofitable vehicle models.
"I don't think it went wrong," Padilla said, referring to the 2002 plan. "None of us anticipated the aggressive pricing in the marketplace."
"When we put our plan together we assumed that incentives and the like would be in the range of 13 to 14 percent," he said. "Reality is that incentives has been 18 to 20 percent for the last several years."
Subscribe to:
Posts (Atom)
