http://news.yahoo.com/fc/Business/Real_Estate_and_Housing/
http://www.jsonline.com/bym/news/nov05/373347.asp
D
Tuesday, November 29, 2005
Market comments
Dow Up, Nasdaq Down in Afternoon Trading (YHOO)
Tue 2:36PM ET - AP
Stocks were mostly higher Tuesday as Wall Street struggled to extend its recent advance despite a trio of upbeat reports on factory orders, housing demand and consumer confidence. A drop in the bond market, which fell on fears of higher interest rates, helped put a cap on stocks' advance.
· Consumer Confidence Numbers Soar in Nov. AP
· Oil Prices Down As Warm Weather Persists AP
· Federal Vioxx Trial Gets Started in Texas AP
CPN under a $1
TOL reversing RED
Bull markets SOAR on good news. 11K in sniffing distance.
D
Saturday, November 26, 2005
SPX/VIX RATIO
http://stockcharts.com/def/servlet/SC.web?c=$spx:$vix,uu[w,a]daclyiay[df][pc20!c5!f][vc60][iut!La12,26,9!Lh14,3]&pref=G
Nearing nether reaches here IMHO, imminent correction is at hand. NOT necessarily the end of current move.
D
Nearing nether reaches here IMHO, imminent correction is at hand. NOT necessarily the end of current move.
D
HIGH OIL/GAS PRICES CAUSE RECESSIONS
 http://www.eia.doe.gov/cabs/oprevecn.html
It doesn't take a genius to see the relationship, now how with near $60 oil for better part of year does US GDP hold up? When EVERY time in the past gas soared to such levels a Recession followed? everytime.
Things are different now?
Yes, they are! Historic endebted consumer and zero to negative savings rate.Consumer spending is near 75% of our economy, how sad. If consumers keep up their track record and expand XMAS spending, is there little doubt where that money is going to come from?
ANALYSIS of secular bear and bull markets from 1900 *(live link)
"The big question is now are we in the beginning stages of a 4th Secular Bear Market which started in 2000. The average length of the previous 3 Secular Bear Markets was 18 years with a minimum of 16 years and a maximum of 21 years. Thus if you add 18 years to the year 2000 and take + or - 3 years on either side then the next Secular Bull Market may not begin until sometime in the 2015 to 2021"
CYCLICAL BULLS "also had four cyclical bull markets that ranged from 21 to 38 months in length and the Dow"
Current bull began OCT 2002, so it has run for about 37 months! MY FRIENDS is that long in the tooth or what?
Secular Bears tend to follow Secular Bulls, last bull was SECULAR, longest running in history, what should follow??? a 3 yr correction that only took stocks to trailing 30X SPX?? 2% Dividend yields? NO!! Bottoms are made with single digit SPX and 6% yields.
Trade, be happy, be aware what kind of market conditions you are in, IMHO
Duratek
NOV 15TH Dr Richebacher
BEST OF KURT RICHEBACHER
November 15, 2005
http://www.investmentrarities.com/archives.html#rp
INFLATION HAS MANY FACES
The narrow concept of inflation as a rise in consumer and producer prices made perfect sense until the late 1970s, as long as credit excesses used to go overwhelmingly into the purchases of goods and services. But ever since, it no longer makes sense, because credit excesses are dispersed over much wider areas, in particular asset markets and imports.
Judging simply by the atrocious credit and savings numbers, the U.S. economy has the most rampant credit inflation around the world. It shows lately in the huge trade deficit (lately at an annual rate close to $800 billion); it shows in grossly overvalued asset markets running into many trillions of dollars (mainly bonds, stocks and housing). But lately, it is also increasingly showing in the consumer and producer price indexes.
It is a regular comforting mantra in the Fed’s FOMC press releases that "Core inflation has been relatively low in recent months and longer-term inflation expectations remain well contained, but pressures on inflation have stayed elevated." Emphasis on "core" inflation serves to distract attention from the ugly realities in price inflation.
After all, U.S. inflation rates of consumer and producer prices are now at the top in the world, even despite the Fed’s gross understatement. As of September 2005, the PPI was up 6.7% year over year. A year earlier, in August 2004, the 12-month rise was 3.3%. As to the CPI, it showed a rise of 4.7% year over year in September, as against 2.5% a year earlier. Import prices are up 9.9%.
Annualizing the price increases over the last three months, the numbers become outright frightening. For the PPI, in September, it was 14.8%, for the CPI, 9.4% and for import prices, 20.5%.
Presenting these numbers, we have to repeat our familiar mantra that heavy hedonic pricing and quite a variety of other statistical ploys have substantially reduced the reported U.S. inflation rates. Conservative estimates put their downward effect on the consumer price index at 1–1.5 percentage points per year. Critical observers put them closer to 3 percentage points.
Yet even the officially reported, understated CPI rate of 4.7% has become uncomfortably high, considering that second-round effects of the surge in oil prices are possible, and even probable.
Until quite recently, the Fed prided itself on having learned from Japan’s experience that a bursting asset bubble should be treated with fast and massive monetary easing to moderate its aftermath. This assumes, first of all, that belated rate hikes are the main reason for the protracted dismal performance of Japan’s economy. It is hard to see how a mere delay in rate cuts can have such devastating long-term effects. In contrast, Japanese experts regard two quite different reasons as most important. They cite structural problems caused by the prior credit excesses and never-ending deflation of house prices.
Mr. Greenspan claims great success that with his policies he managed the U.S. economy’s mildest recession in the postwar period. Actually, he replaced the bursting equity bubble with a whole variety of other bubbles, of which the housing and the bond bubbles played the leading roles in fueling America’s greatest consumer borrowing-and-spending binge.
The trouble is that with these new bubbles, the U.S. economy and its financial system have accumulated ever-greater imbalances and excesses. And while the ensuing housing bubble saved the economy from deeper recession, it should be realized that a housing bubble is a far more dangerous specimen than an equity bubble. There can be no question that the economy today is in far worse shape today than in 2000–01.
It strikes us that the Fed’s increasingly hawkish talk lacks the slightest hawkish action. Rather, it keeps adding reserves to the banking system in order to prevent the federal funds rate from rising above the targeted 3.75%.
In other words, the Fed is accommodating increasing demand for reserves, due to continuous strong credit demand. In general, reserve policy outweighs interest rate policy in its effects on the economy and the markets. It explains why the credit rampage has so far not shown the slightest moderation. In terms of bank reserves, monetary accommodation remains in full force.
We keep wondering what the Fed has in mind with its new policy. First of all, let us make it clear that even a federal funds rate of 4.5% is anything but high compared with present inflation rates. But apparently, it is widely perceived as very high, possibly too high, and that tells us something about the U.S. economy’s truly perceived strength.
Friday, November 25, 2005
Dr Faber "Road To Ruin"
http://www.howestreet.com/story.php?ArticleId=1736
I expect Dow to better 11K, was suprised though a close over it was rebuffed, next level would be 11,301
D
I expect Dow to better 11K, was suprised though a close over it was rebuffed, next level would be 11,301
D
Thursday, November 24, 2005
THANKSGIVING FOR FINANCIAL SENSE
http://www.financialsense.com/stormwatch/2005/1123.html
We are at the area AGAIN that had previously marked the mkt top, which is 30% ABOVE the 2000 relationship, then said bull mkt high from 20 yrs of rally.
http://stockcharts.com/def/servlet/SC.web?c=$SPX:$VIX,uu[w,a]wallyiay[pc20!c50!f][vc60][iut!Ub14!Ua12,26,9]&pref=G *NOTICE HOW macd IS WEAKER STILL*
I hold this relationship in HIGH REGARD. You can observe how the ratio CALLED the 2002 low, do you not? You could have bought wth both fists then could you not? the fact we STILL reside 30% above the 2000 high relationship is PROOF enough of the excessive ill placed bullishness seemingly ingrained, unending.
When Greenspan exits, so will the bull, you heard it here first. Enjoy the turkey, we must be sure we don't end up on the menu.....They say WAGE GROWTH will sustain spending???!!!! They say consumer in great shape, that debt is no problem, that no savings is a non issue. They say there is no need for M3 data.
There are SO MANY DIVERGING relationships as dynamic as the one above, none point to beginning of anything wonderful
Duratek (my elbow tendanitus is keeping this brief)
Tuesday, November 22, 2005
GOLD LOOKING FOR $500
"It seems almost inconceivable that we won't see $500 very soon, but it may have just done a bit too much this week" said John Reade, precious metals analyst with UBS Investment Bank.
Reade has just revised up his one-month average price target for gold to $465 an ounce from $440 previously. He, along with several traders and other analysts, said sell orders were building at $495 to $500 an ounce.
They said if gold did not manage to punch through $500 today or Wednesday, it may attract selling if U.S.-based investors decide to take some profits ahead of a long holiday weekend.
We continue to find it difficult, if not impossible, to justify the strength of the gold price with respect to any underlying economic relationship," he said, referring to a strong dollar, weaker oil prices and a massive surplus in the gold market.
"Nevertheless, the strength of the recent price action over recent days has been very impressive and against this background further gains are likely."
Barclays Capital estimated flows of money into commodities by U.S. mutual funds had risen 7 percent to $4.9 billion so far in 2005.
Another new product started trade Tuesday, with the Dubai Gold and Commodities Exchange launching a gold futures contract.
LONDON (Reuters) - Gold moved closer to the fabled $500-an-ounce level not visited since 1987 on Tuesday as investors shunted more money into the metal, but profit-taking ahead of a long weekend in the United States could prove a drag.
LONDON (Reuters) - Oil rose a dollar Tuesday on expectations colder temperatures in the Northern Hemisphere will ignite heating fuel demand after weeks of unseasonably warm weather.
U.S. light crude for January delivery rose $1.01 to $58.71 in electronic trading. The contract rose 49 cents Monday, helping the market bounce back from Friday's five-month low
NEW YORK (CNNMoney.com) - Here's what consumers can look forward to when the midnight bell-ringing comes to a stop: sharply higher home heating bills, holiday credit card bills, rising interest rates -- and now what looks like a slowing real estate market.
Consumer spending could suffer in 2006Cooling real estate market could finally force consumers to pull back. The impact could be huge (NOT BULLISH FOR COMMODITIES IMHO)
Saturday, November 19, 2005
Company of Interest
http://www.qtww.com/index.php
I have been studying themarket for years, and developing a system whereby I can help myself determine good risk reward trading opportunities. The dry runs are over, you gotta pay to play.
The ONLY reason I am going to list my trades (buys and then sells when I do) are to have a RECORD of how well I do. I am going to try to find ONE good trade a week, I wont force anything.
As an investor you can be paralyzed by analysis and lack of confidence, and many times driven to inaction becuase there is no way to avoid risk even on the "sure thing", which none are.
My problem has been the HOME RUN syndrome, and because that usually takes more cash to play, I wouldn't. SO I passed up winning trade after winning trade, a few of course didnt pan out, but most did.
I feel it more effective to adapt a single rule, not shooting for the moon. It is not important I List how many shares, just what and what price. I am not asking nor suggesting anyone follow any of my stock buys.
The link shows my interest, it is also a company with near $90 M revenues (listed on YHOO) and selling less than 1 X sales and about 1.29 book value, and I found this attractive. They had a few government contracts, so there is some interest here.
Wacthing it fall recently, I know not why, I felt we might be near some king of selleres pause if nothing else. $2.55 is price paid Fri., follow for amusement only.
I hope to prove to myself I can trade successfully, sometimes using stop losses to avoid LARGE LOSSES.
I avoided the BEAR MKT for many reasons, but in any environment there are opportunities, ifone spends enough time investigating, watching listening, reading, researching, becoming familair with, then using TA to "try" and pinpoint best buying opp.
I'm not going to get too jiggy here, just play money, market getting to some extremes in bullishness and overbought.....a pause that MIGHT refresh could be coming next week.
Buying is easy my broker will say, "it is the selling" that is the hard part!
When some "oh no Duratek is bullish" dont confuse seeing the rally for what it is, and continuing to look for potential trades. It NEVER pays to be too bullish nor bearish.
D
Friday, November 18, 2005
http://research.stlouisfed.org/publications/usfd/page3.pdf
This is counter intuitive to current market rally. It is following SAME pattern as 2004 nov/dec ONLY other time it made a lower low!!
I smell a rat trap in this rally, should/will go much higher perhaps, could fall just as sharply without notice.
A key important high is being put in. 3rd week in row this has fallen. End of yr bullishness hides economic concerns in 2006.
UARM should open with a blast this AM, upwards of $13.....GL and GT.
http://www.investmenttools.com/futures/bdi_baltic_dry_index.htm
Turned back at the first FIB, same time Transports are making NEW HIGHS!!??? I cannot justify this.
Buying power surged Thursday, so I expect higher prices. 10,742 on Dow SHOULD be blown thru today OPEX FRI.....you never know.
BULLY time of year. Tech rallues even with weakness in the powerhouses INTC CSCO MSFT and DELL AMAT none say we are getting jiggy here, yet GOOG above $400
Back in 1999, the FINAL runup made no sense, there was great fear of "missing out", I am sensing that here right now. The difference? 8,000 HEDGE FUNDS controlling 50% of the action or near it, some owned by LARGE BROKERAGES HOUSES, yr end bonuses on the line and they are going to JAM the performance down the markets throat.
SO, if pattern of adj money base continues, its decent is not bullish for down the road, market peaked right at end of year, JAN was weak, long term cycles are pointing down, but there are so many different ones, each could exert pressure.
Japan is ROARING higher each night, lots of savings there, 50% above the lows Japan appears BACK, inlfows into US are strong, this we will watch.
D
Thursday, November 17, 2005
MOONSHOT IS POSSIBLE
"Silver has broken out" hey what happened to EWT's $3 target??. If silver goes....gold goes....dollar falls, rates SHOULD rise. (SIL and SSRI 2 silver stocks)
Only question...'WHY Are the metals breaking? damnit, this shouldn't be bullish for stocks!
Like 1999.....none of this is going to make any sense, I'm getting feeling entire market is going to go...BALLISTIC.
And it will be like 1999 again, a MOVE Like that might be needed to have an "everybodys in the pool", shorts capitulate, when that happens, noone left to halt or slow the slide.
World markets are rising, additional BUYING , the funds for this coming from somewhere, and after 2 years of consolidating, the move up could be very dramatic.
When the fall comes 2006, 2050 who knows.........it will be an apocolypse. AS debt piles on itself to the moon, but with FED and Central BAnk liquidity everythings floating up.....it seems like everything, market is ovebrought, feels like not ready to to correct yet
Duratek
IT HAS ONLY GOTTEN WORSE!
BEST OF BILL BUCKLER
August 12, 2004
Here comes the economic clincher. Total US credit market debt (government, corporate, and individual) is $37.1 TRILLION. Debt is over 300% of GDP and still growing. Total credit market debt had reached 260% of GDP in 1929 on the eve of the Great Depression. Today, US total credit market debt has doubled over the past five years. The US Treasury Department has reported that there are $44 TRILLION in unfunded liabilities in the "Entitlement Programs". That alone is more than the net worth in the country. Added up, funded and unfunded US liabilities come to $US 81.1 TRILLION. The US net international debt position to the rest of the world stood as of March 31 at $US 5.2 TRILLION. Clearly, the USA is tapped out. It is running on empty momentum…..
Consider the pace of Fed debt "monetisation", as published by Mr. Russ Winter and taken from figures on the Fed's website:
In the year (52 weeks) which ended on May 5, 2004, average weekly Fed "monetisation" (outright buying of Treasuries with newly-created Federal Reserve Notes - aka US Dollars) averaged $US 577 million per week. In the 12 weeks between May 12 and July 21, that average weekly figure jumped to $US 1,395 million, just under two and a half times the pre May 12 level.
Over the last eight weeks of that twelve week period, the average weekly figure grew further to $US 1,532 million. Here are the clear tracks of the Fed "compensating" for the drop off in Japanese Treasury purchases. Here also is the evidence of the US Central Bank having to directly inflate its own currency through outright "purchase" of US Treasury debt instead of standing benignly by while the Japanese (and Chinese) Central Bank does the purchasing by inflating their own currency, the Yen. This is pure, unadulterated, unvarnished INFLATION by the US Fed which cannot fail, in time, to hasten the erosion of the purchasing power of the US Dollar.
But the Fed doesn't stop simply at "monetising" Treasury debt. It also has a practice which it calls "Permanent Open Market Operations". These are very low interest rate loans which it makes to "selected" financial institutions, as and when it deems them required. They are "required" whenever the Treasury markets look a little shaky, and or when there is a potential for them to look a little shaky, like just before a big Treasury auction, especially the quarterly refunding auctions. These "permanent injections of new liquidity" have been averaging well over $US 1 Billion per week since early May.
The Fed speaks of its "mission" as being one of fostering "sustainable growth" and its core task as being one of preserving "price stability". In its actions, the Fed has been creating new "money" at a pace never before equalled over the past three months while watching "growth" ebb away again. It has also advanced a long way on the path towards destroying the credibility (let alone purchasing power) of the currency of the United States. Remember that the next time you hear a speech from Alan Greenspan.
Ó 2004 – The Privateer
http://www.the-privateer.com
Wednesday, November 16, 2005
MKT STRENGTH WEAK
NAZ
New Hi's 44
New Lows 64
DOW
New Lo's 214
New Highs 95
Market also came up to its rising 2003 lows trendline which it broke under, spinning wheels here, or pause to rise?
GOLD SPURTED higher today NEM rose almost $3 !! OIl and GAs strong across the board.
Lots of data tomorrow, ignore CPI and PPI data as it is crap.
D
OUTLOOK FOR REAL ESTATE SOURS?
http://money.cnn.com/2005/11/14/real_estate/buying_selling/prices_going_south/index.htm
NOT going to happen overnight, higher rates a factor, 50% SPECULATORS buying into FLA condo units a STERN WARNING
As suggested why in the world would the FED discontinue M3 data?
D
NOT going to happen overnight, higher rates a factor, 50% SPECULATORS buying into FLA condo units a STERN WARNING
As suggested why in the world would the FED discontinue M3 data?
D
Tuesday, November 15, 2005
BLS BS
U.S. October Producer Prices Rise 0.7%; Core Prices Fall 0.3%
Nov. 15 (Bloomberg) -- U.S. producer prices rose last month as costs increased for natural gas and heating oil. Excluding energy and food, wholesale prices declined by the most in more than two years, reflecting cheaper cars and clothes.
Prices paid to factories, farmers and other producers rose 0.7 percent following a 1.9 percent increase that was the biggest in 15 years. Excluding energy and food, so-called prices dropped 0.3 percent after a 0.3 percent rise in September.
Companies have had limited success passing through higher costs for energy and other commodities in the last year. The decline in the core, partly a result of how the government values new model year automobiles, won't be enough to keep Federal Reserve policy makers from raising interest rates to ensure inflation doesn't accelerate, economists said.
**Keep the illusion going.......consumers tapped out will go deep for XMAS, companies NOT passing on higher costs? why arent profits falling?
D
Saturday, November 12, 2005
From DOUG NOLAND and my comments
The Treasury market was volatile but finished yesterday with a strong rally. For the week, two-year Treasury yields declined 4 basis points to 4.43%. Five-year government yields fell 7 basis points to 4.49%. Bellwether 10-year yields dropped 10 basis points for the week to 4.57%. Long-bond yields declined 8 basis points to 4.74%. The spread between 2 and 10-year government yields declined about 6 to 14bps.
Junk bond fund outflows rose slightly to $138 million (from AMG).
Japanese 10-year JGB yields declined 4 basis points this week to 1.565%.
Broad money supply (M3) dipped $1.4 billion (week of October 31) to $10.075 Trillion. Over the past 24 weeks, M3 has surged $450.1 billion, or 10.1% annualized.
AS you guys already know!! November 10 – Bloomberg (Vincent Del Giudice): “The Federal Reserve announced today it will discontinue reporting data on the broadest measure of the money supply, M3, effective March 23, 2006.”
INSANITY REINS!!!
Total Commercial Paper surged $19.3 billion last week to a record $1.661 Trillion. Total CP has expanded $247.5 billion y-t-d, a rate of 20.2% (up 21.4% over the past 52 weeks). Financial CP jumped $14.6 billion last week to $1.496 Trillion, with a y-t-d gain of $211.7 billion, or 19.0% annualized (up 21.3% from a year earlier). Non-financial CP increased $4.7 billion to $165.3 billion (up 31.9% ann. y-t-d and 22.5% over 52 wks). WOW!!!!!
Copper traded to another record high.
FRICKEN SAD!!!!! China Watch:
November 10 – Market News International: “China’s exports for October alone rose 9.7% year-on-year to $68.09 bln and imports were up 23.4% at $56.08 bln… Exports for the first 10 months of this year rose 31.1% to $614.49 bln and imports were up 16.7% at $534.12 bln for the 10-month period.”
November 7 – Bloomberg (Ben Sills and John Fraher): “European Central Bank council member Nicholas Garganas said money supply growth is a ‘serious risk’ to inflation and may tip the bank toward its first increase in interest rates in five years. ‘There is no question that the recent acceleration of M3 growth poses some serious risks to long-term inflation,’ said Garganas… Should the ECB see ‘any indication that the risks to inflation are likely to materialize, we will act.”’
**Broker Dealer stocks set NEW HIGHS!! November 9 – Bloomberg (Gregory Cresci): “After paying more than $12 billion in fines and settlements over four years, Wall Street firms including Goldman Sachs Group Inc. and Lehman Brothers Holdings Inc. are headed for their biggest profits since 2000.
DANGER WILL ROBINSON: Speculator Watch:
November 8 – Bloomberg (John Dooley): “The growing use of credit derivatives by hedge funds is adding risks to global credit markets at a time when bankruptcies at companies such as Delphi Corp. have raised concerns about declines in credit quality, according to Fitch Ratings. ‘Hedge funds are punching above their weight,’ said Roger Merritt, senior credit officer at the ratings company… The use of leverage and active trading strategies has increased their ability to influence markets and may change the behavior of credit markets during the next downturn.’”
**And this “leverage” is what is being used to goose stock markets?
POOLE FOOL : Moreover, the U.S. case is unique in a number of respects. The central role of U.S. financial markets—and of the dollar—in the world economy suggests that capital account surpluses, and therefore current account deficits, are being driven primarily by foreign demand for U.S. assets rather than by any structural imbalance in the U.S. economy itself.”
"We can all benefit from our good fortune in having access to increasingly safe, liquid and transparent financial markets. The United States has created for itself a comparative advantage in capital markets, and we should not be surprised that investors all over the world come to buy the product.”
DOUG DOESN’T AGREE!!! It is my view that the U.S. Current Account Deficit is today the most problematic imbalance in a world of gross imbalances and that it is poised to be the most pressing and intractable economic issue over the coming months and years. It is also my view that Dr. Poole has surpassed even Professor Bernanke as the framer of the most specious and dangerous analysis to originate from our Federal Reserve System.
IN CONCLUSION DOUG WRITES
A lot of things are uncertain these days, but as long as the world accommodates $800 billion U.S. Current Account Deficits – and the Fed is more than ok with it - it’s a safe bet that there will be heightened global inflationary pressures, increasingly unwieldy financial flows, and only greater Monetary Disorder. And, I might add, the word “debtor” (nation) is not the least bit misleading.
http://www.prudentbear.com/archive_comm_article.asp?category=Credit+Bubble+Bulletin&content_idx=48581
Friday, November 11, 2005
Best Of Richebacher NOV
BEST OF KURT RICHEBACHER
November 7, 2005
The U.S. economy’s mainstay of growth, consumer spending, is down sharply since June, to wit, well before the hurricanes hit. The U.S. asset and credit bubbles have gone to such exorbitant excess that an abrupt reversal appears possible, if not probable. The reality of the situation is that the U.S. economy and its financial system have become addicted to continuously greater credit excess. As we shall explain, there is far more economic and financial weakness in the economy than most people realize…..
U.S. economic growth depends precariously on the full-blown continuance of the housing and refinancing bubbles as the shortfall of consumer incomes continues unabated. In addition, accelerating inflation rates are taking their toll. Consensus economists remain steeped in denial.
For sustained economic growth, it is imperative that corporations take the baton from the struggling consumer with a strong pickup in fixed investment. There is no reasonable indication this will happen. Instead, they are pouring record amounts into stock buybacks, mergers and acquisitions.
The bulls will jump at the idea that new rate cuts by the Fed will quickly reverse the situation in the markets and the economy. But there is little room for new monetary and fiscal stimulus, while the economy is in far worse shape than in 2000. After all, the Fed is sure to "push on a string."
But do not think that bonds will be a safe haven under these circumstances. Being built completely on highly leveraged carry trade, they are extremely vulnerable to any kind of disturbance.
Tuesday, November 08, 2005
It'S ON
*(EWT call for Bond Rally might be accurate with 9% daily bull reading from MDH Advisors)
Toll Brothers Cuts 2006 Delivery View
Tue 9:37AM ET - AP
Toll Brothers Inc. reported Tuesday robust gains in its fiscal fourth-quarter home building revenue, backlog and contracts, but the luxury home builder also trimmed its home deliveries forecast for fiscal 2006, citing fewer than expected selling communities and weakened demand in several markets.
Monday, November 07, 2005
CHART OF THE DAY

*(click to enlarge) A few notes
Credit Bubble: (Doug Noland)
Junk bond fund outflows increased to $132 million (from AMG). Issuers included Chukchansi Economic Development Authority $310 billion, Atlantic & Western $300 million, and Rural Cellular $175 million.
Broad money supply (M3) expanded $10.2 billion (week of October 24).
*(below from contrarianinvestor.com)
And what is also crystal clear is that with the recent absolute price level correction in stocks, the relationship of the S&P relative to gold is breaking through the lower level of the 2003 to present trading channel to the downside. Technically, not much lies below this trading channel except the lows in this relationship that date back to the first quarter of 2003. Remembering that as the S&P has underperformed gold in the past, the absolute S&P itself has been declining, does this recent break of relationship trend to the downside between the S&P and gold foreshadow what may indeed be the resumption of the primary bear trend in equities?
Again, we’re not suggesting this to be ultra bearish, but rather we’re simply trying to listen to market history whisper in our collective ears. In our own little financial market playbook of life, we’d consider a break of the SPX and gold relationship ahead below the early 2003 low to be a very negative omen for the macro equity market. We'd consider it "game on" in terms of resumption of the macro bear. Will we get there? We'll see.
As you’ve noticed, we've shaded periods of the S&P underperforming gold in red in the chart below. Of course these also correspond to very weak, or flat at best, periods of absolute S&P price performance. But, in our minds, what is most important in the chart below are the very well defined long term upward trend lines. To be honest, these trend lines are virtually picture perfect in terms of having captured very important price bottoms over the last 15 years.
Sunday, November 06, 2005
FAT FARM
Is the Consumer ready to join the "BIGGEST LOSER" show??? http://biz.yahoo.com/ap/051105/wall_main.html?.v=4
Brudda's, WOOOOOOFFFFF Colonial WMSburg.....lets just say I've seen it, dont need to go back, PLUS ONE HOUR JAM to go 2 miles...eighhhhhh.
SO I pull off, I GOTTA PEE!!!!!!!!! McDonald's......hungry,,,,,dinner? HAndicapped person behind counter...OK..UNTIL she came out and said "MAY I HELP YOUUUUUUUUUU??? AFTER SHE licked something off her arm!! LOL NO....THANK YOUUUUUUUUU!!!!
Market....i think she got a short term pulback comin', then 200-300 point spurt could take 2-3 weeks, maybe hold up into DEC not sure. Somewhere in here I intend to double up on RYNVNX, and go LONG BONDS.
During this period, the market has rallied, in the face of rising bond yields, falling VIX, but we wont see a new low in VIX. And I am not sure we see a new high in yields, but the market isant going to sell off IMHO if money isnt being diverted into bonds at 23% bullish opinion.
EWT thinks the current rise in rates ENDS with a SPIKE, that should bring bullishness down to near recent lows of 10% previous high in yields. That would certainly be SUPER sign to enter with reduced RISK.....could falling rates accompany a rally in stocks? I dont think so because up til now, the mkt is reflecting economic strength (3.8 GDP) not expected weakness....."LOOK how good we're doing even after all this other shit?!"
This FASCADE will be shattered by either WEAK CONSUMER SPENDING for XMAS, or some other event I cant know.
EVERY TIME GAS has reached current levels of price a RECESSION has FOLLOWED (thurs King), they are fricked LOADED TO THE GILLS with inventory for a big xmas......the have's are doing great, but the have nots run the economy.
Housing has topped. Dont know if consumer has cried uncle on credit yet.
WHY THE WORST IS AHEAD?
We want to think the bear mkt is over, but when you look at historic charts we know this is just wishful thinking. TOTAL CREDIT MARKET DEBT carries itself each day to higher historic levels. GAs has fallen but reg is stil near $2.30 and most cars take Premium near $2.50, reg was near $1.69.
Trucking may be going crazy as all this XMAS crap is being shipped out of warehouses to stores. WHAT IF GRINCH SHOWS UP INSTEAD?
SO, maybe XMAS will be unexpected HIT? VOLUME in market argues for continuation of rally. Slowing here will be initial sign. Fall in retailer another one. Falling stocks accompanies by falling commodities oil etc another one still.
Recession dont occur with rising commodities, reduced demand causes them to fall. XLE< oil ,COPPER arguably may have topped. SO has the Cyclical BULL expansion.
Hasnt it been fueld by the housing bull? IS there another leg up there? JUST LIKE that consumers quickly lose interest in fuel efficient cars, as gas drops, only worry was of getting it? Shortages? (PER FRI USA TODAY)
4.6% 10 yr is NOT luring investors away from stocks? hmmmmmmmm. but it has sadly outperformed stocks in general.
Bond prices usually rally when economic data looks weak, when BEAR MKT roars again, what better place to reside then there?
CONSUMER is in worst shape then ever before, no savings, nothing to fall back on, loaded with houses cars and stuff, past Recession and Bear mkt was highlighted by expanded debt, not a righting of ship and getting "house" in order. There are a lot of first going on here.
Future have 3 more rate increases priced in, so unless we get HUGE spike in yields will be difficult to time an entry into bonds. IF for any reason yields approach 5%, it will be considered a done deal they wil keep rising and we will get our 10% or lower sentiment reading.
Then I would say who is left to sell? OUR FOREIGN FRIENDS? Like I said, we will probably be among those negative, buying right is never easy.
GOOG near $110 B mkt cap, what a love afair. What FEAR? is that not a poster child for buying to sell higher?
EVERY similar spike in energy costs has yielded a Recession, the one we are going through the worst of bunch, so far 70 degree NOV has made us forget winter energy prices. But Winter IS coming. And so is K-Winter, I am sorry to say, and you guys know this cycle is LONG LONG overdue.
The FED has made a mockery of FREE MARKET rules, HELL TO PAY>
D
Friday, November 04, 2005
ONLY A FOOL CAN BE FOOLED
http://www.contraryinvestor.com/mo.htm *MUST READ
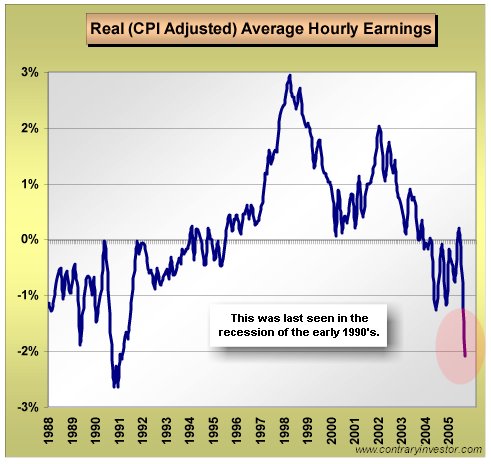
Reason inflation isn’t more visable is 2 fold. A) Gov stats lie lie lie,
http://www.contraryinvestor.com/mo.htm please observe CPI charts and wages.
B) THE MORE companies get price pressure, the MOE they shift to Chinese production to control prices! PLUS passing along costs as CLOREX suggested they would be raising prices directly adding to core pressure even if they don't choose to show it.
This all taking us further down the road to purgatory and destruction of our economy, and further enslaving Chinese workers and Americans to debt.
OK so I did post one anyway, later. PLUS the AVIAN FLU scare is just that, slight of hand, diversion to REAL ISSUES.
D
Thursday, November 03, 2005
U.S. and the Global Economy
*(From NY FED horse mouth so to speak)
U.S. and the Global Economy
October 19, 2005
Printer version
Timothy F. Geithner, President and Chief Executive Officer
Remarks at the Asia Society’s CEO Forum in New York City
I want to focus my remarks today on the imbalances in the world economy and their implications for the United States and Asia. These imbalances, which are most visible in the U.S. current account deficit, present challenges—and risks—for the world economy. How we manage these challenges will have significant implications for our economic future and for the rest of the world.
The sources of these imbalances are varied and complex. They are the result of fundamental changes in the world economy, changes not anticipated and not fully understood. They involve economic forces across the global economy, some transitory and some probably more enduring. The imbalances took a long time to build up and they will probably take a long time to unwind.
The magnitude and persistence of these imbalances seems to be the result of the interaction of two forces. The first involves a decline in U.S. savings relative to domestic investment, matched by an increase in savings relative to investment in parts of the rest of the world, principally in emerging Asia and the major oil exporters.
In the United States, public savings and household savings fell, while investment spending stayed reasonably strong and housing investment very strong, even during the latest recession. In the economies that became large net savers, the pattern differed across countries. In some countries, including much of emerging Asia and Japan, savings has been flat or fallen somewhat, while investment has fallen by more. In China and in the major oil exporters, investment spending is rising, but not by as much as savings is increasing. Europe’s net external position has not changed much over this period, and is in rough external balance overall, with substantial differences across the member states.
The second feature of this dynamic has been an increase in the willingness of the rest of the world to invest its savings in the United States. In those parts of the world where savings are high, they have become more globally mobile. And a greater share of those savings found its way to the United States. This phenomenon is due in part to the perceived attractiveness of relative returns in the United States arising from the acceleration of productivity growth here, and in part due to the dynamics associated with exchange rate regimes linked in one way or another to the dollar.
Together these forces have produced larger imbalances—deficits here and surpluses abroad—that have been sustained longer and financed more easily than conventional wisdom would have thought possible a decade or even five years ago.
Why does this pattern of imbalances matter and why should it concern us?
It matters because of the size of the U.S. imbalance. Our current account deficit is now running at a rate of above 6 percent of GDP, a level without precedent for a major economy.
It matters because of the composition of the imbalance. Our trade deficit is now roughly the size of the current account deficit, and very large relative to our export base. And our net investment income balances are now likely to move into deficit.
It matters because of the trajectory of the U.S. imbalance. On reasonable assumptions about its likely near term path, this deficit will produce a very large net deterioration in our net external liabilities relative to national income, with progressively larger net transfers of income to the rest of the world.
This pattern should concern us because it is not simply the result of the savings and investment decisions of the private sector. The fact that we are using a substantial part of the savings we are borrowing from the rest of the world to finance an unsustainable level of public borrowing leaves us more vulnerable than if those savings were being used for productive private investment. Large structural fiscal deficits limit the size of the sustainable external imbalance for any country, even the United States, and they necessarily increase concern about the terms on which we are likely to finance the present imbalance.
It should concern us because of how the imbalance has been financed. A substantial portion of the capital inflows that finance our current account deficit has come from foreign central banks—which have been accumulating dollar reserves to preserve exchange rate arrangements that are unlikely to be sustainable and are already in the process of change. The impact of a reduction in the scale of official accumulation of dollar assets could be fully offset by increases in purchases by private investors. But even in the context of a continued high degree of confidence in the relative return on claims on the United States, it is hard to know with confidence how the preferences of private savers might respond to the process of gradual evolution in their nation’s exchange rate regimes now underway.
And most importantly, perhaps, these imbalances matter because at some point they will have to reverse. Market forces will at some point induce an adjustment. And that inevitable process of adjustment will bring with it the risk of large movements in relative prices, greater volatility in asset prices and slower growth in the United States and in the rest of the world.
The magnitude of this risk is difficult to measure with any confidence. Past episodes of external adjustment offer some reassurance, but the present circumstances seem sufficiently different from historical precedent that history may not be a particularly useful guide.
The size of the imbalances and the persistence of the forces supporting them probably mean that we will be living for a prolonged period of time with the tensions that could come with the need for adjustment.
The risks associated with this adjustment process may be magnified by changes in the household balance sheet in the United States. The average household in the United States today has a higher level of debt to income and is somewhat more exposed to interest rate risk than in the past. The sustained rise in housing prices and the scale of borrowing against housing assets raises the possibility that a rise in risk premia could have a greater impact on household spending than would have been true in the past.
The adjustment process is also complicated by the fact that the rest of the world does not appear likely, even over the medium term, to be in a position to provide a sufficiently strong offsetting source of demand growth to compensate for the necessary slowing in U.S. domestic demand. Policy actions to promote structural reform in the labor, product and financial markets could potentially change this, but the policy changes required are politically difficult, and their effects on net savings over time might be offset by demographic and other forces working the other direction.
A number of observers have suggested that we can live comfortably with these imbalances for a long time, with very little risk to the U.S. and world economy. The rise in the surplus savings of the rest of the world, the relative ease with which those savings now move across borders, and the increase in the relative attractiveness of claims on the United States together may suggest the world can sustain larger imbalances, more easily, for a longer period of time.
These factors, however, do not alter the fundamental judgment that our external position is unsustainable and the adjustment process ahead could materially affect future economic outcomes. The fact that these imbalances might be sustained for some time shouldn’t make us more confident that they will be. Even if we could be confident that the world would be comfortable financing the United States on these terms going forward, that would not make it prudent for the U.S. to continue borrowing on this scale.
Time doesn’t necessarily help. The longer these gaps continue to build, the greater the risks, and the more difficult their resolution.
What can we do to mitigate these risks?
For the United States, these challenges put a premium on putting in place a more credible fiscal policy framework, maintaining as strong and resilient a financial sector as possible, and preserving an open and flexible economy. These things are all important and desirable, but they are more important, and we can less afford to tolerate any erosion, than would be the case if we were closer to a sustainable external position.
Improving our fiscal position is the most effective means we have available to reduce our vulnerability during this prolonged period of adjustment. We need to produce a substantial reduction in our structural deficit over the medium term and begin to reduce the more dramatic longer term gap between our resources and commitments. And we need to restore a reasonable cushion in our structural budget balance to help us deal with future shocks.
If we are unable to begin to generate more confidence in the capacity of the U.S. political system to produce these improvements, we would face a greater risk of future increases in risk premia. And even though substantial fiscal consolidation would not by itself bring the external imbalance down to a more sustainable level, it would improve the prospect for a smoother adjustment to that outcome.
The general risk inherent in these imbalances—the risk of more adverse growth outcomes and asset price volatility—reinforces the importance of sustaining the strength and resilience of the U.S. financial system. Our financial system today is in substantially stronger shape than it was even in the recent past, and the major institutions now appear to be managed so that they are less vulnerable to the type and magnitude of shocks they’ve experienced in the past couple decades.
Our challenge, however, it to make sure they are as well positioned to deal with the full range of potential future risks. And this requires an investment in risk management and controls commensurate with the increasing complexity of these challenges, and it requires a cushion of capital and liquidity large enough to capture the potential risk of losses in a less favorable macroeconomic environment.
The increase in the flexibility and resilience of the U.S. economy over the past two decades has a lot to do with the increased openness of the U.S. economy. And sustaining this flexibility, which is so important to our capacity to adjust to shocks, requires that we continue to support the process of openness and economic integration. We jeopardize future income gains if we are unable to sustain support in the United States for what has been a relatively open trade policy. How effective we are in meeting this political challenge is likely to depend significantly on how effective we are in improving educational opportunity and achievement in this country, and perhaps also in improving the design of the temporary assistance we provide individuals who bear the brunt of the adjustment costs than come with greater global economic integration.
These policies by the United States would help improve the prospects of a more benign adjustment process. But they would not be sufficient to produce a more favorable adjustment path. A more favorable adjustment scenario would require a complex mix of policies and action in each of the major economic areas, sustained over a considerable period of time.
For global growth to be sustained at a reasonably strong pace during this period of adjustment, the desirable increase in U.S. savings and the necessary slowing in U.S. domestic demand growth relative to growth of U.S. output would have to be complemented by stronger domestic demand growth outside the United States, absorbing a larger share of national savings. Exchange rate regimes, where they are currently closely tied to the dollar, will have to become more flexible, allowing exchange rates to adjust in response to changing fundamentals.
The global nature of these requirements does not imply that the United States can put the principal burden for adjustment on others, or that we can expect the broader global adjustment imperative to easily alter the forces in countries outside the United States that have contributed to these imbalances. If we focus adequate political capital on the factors within our control, we will have more credibility internationally in encouraging policy changes outside the United States that might reduce our collective risks in the adjustment process ahead.
The increase in macroeconomic stability in the United States over the past two decades, or the reduction in the volatility of growth and inflation, has contributed to what seems to be a significant reduction in expected future volatility of asset prices. And the U.S. economy is in many ways in a relatively favorable position to manage through the risks in the adjustment process ahead. The apparent strength in U.S. productivity growth, our greater overall flexibility as an economy and the resilience of our financial system puts us in a stronger position to deal with the challenges in the transition ahead. But we face a number of difficult long-term challenges as a nation—in our fiscal position, in how well we equip our citizens to prosper in a more competitive world and in our ability to sustain political support for the policies, including our relatively open trade policy, that have been an important source of the improvement in U.S. prosperity. Our external imbalances make it more important that we invest in meeting those challenges.
Thank you.
Market Views Thursday
The bulls have the bears retreating, and we have begun the "good 6 months" historically of the market, so those in the know are and have ben getting long.
Volume on this move has been heavy, so it must be respected. Transports spike above 4,000 today a new all time high! This throws market oddly enough, OUT OF SYNCH. Under Dow Theory when the Dow and Trans dont move together, you must beware. That is not to say the Dow will not make a new 2005 high, bu it is a ways away. Utility index also is under its 2005 highs. NAZ is leading % wise, the high beta stocks, willingness to take on risk is returning as the VIX melts away. GOOG at $380 a sign of that, $105 B mkt cap.
STill not a single week of bearish plurality in over 155 weeks. Only 9 weeks since Bear Market began in 2000, sperated another 150 week string.
The setup, potential for a come back in consumer sentiment, who wants to be blue for Xmas, I personally knowmany hurting andworried about high winter heating bills and energy costs. There is good reason WMT plans heavy discounting for XMAS starting very soon. I suspect XMAS retail will be better than expected, people will be willing to pile on even more debt, they always do.
Oil is steady near $60, but could continue to fall, already gas prices have fallen substantially, could add to cheer.
Finally, the wild card is interest rates, rising near previous 4.6% high, I wonder if it can take it out, bullishness towards bonds has melted away, setting up contrarian move, it hasnt shown yet.
But what other than sentiment is catalyst to get jiggy with bonds? The stronger the economy is shown, the less likely a flight to quality will occur.
FED futures suggest 3 more rate increases.
Many still point to Katrina spending as impetus to stay bullish.
If 10 yr breaks out above 4.6% it could spike much higher before retracing, a move such as that would crush positive momentum, and being SO CLOSE to it as we speak, I find it rather odd, the market is shirking it off....because who can see the future?
I leave little hope for any meaningful change in tax code, who is going to touch sacred home interest write off?
ATM tax is coming to MILLIONS of middle class taxpayers, so something has to be done, some kind of trade-off. Have your hand on your wallet, under this adm, the wise guys always come out on top in Cronyville.
A FED that continues to liquify the cash market by operating its printing press around the clock, further exagerating the imbalances in our economy that already exists. We bounce back bewteen ASSET inflation from housing inflation.
Our GDP ismostly Gov and COnsumer spending, so we have a consumptive economy, we go deeper into the 3rd world hole. Because we cannot do any of this from savings, because we have none.
Foreignors now own near 50% of our debt, and they are buying us a piece at a time. WE can NEVER hope to pay back $7 trillion in debt, trade and deficits.
NOT a single spending bill has been veto's by BUSH a first! LOTS of it going to his Crony pals.
Housing has not crumbled and maybe it wont, but that is one EXIT that wont accomodate a hasty retreat.
Everything is not as it seems, and go ahead get seasonally bullish if you must, but equilibrium under our currents ystem of imbalances and historical distortions is going to be a hose of pain when it comes time to pay the piper.
D Am I the last bear standing? *(No posts FRI or this weekend)
Wednesday, November 02, 2005
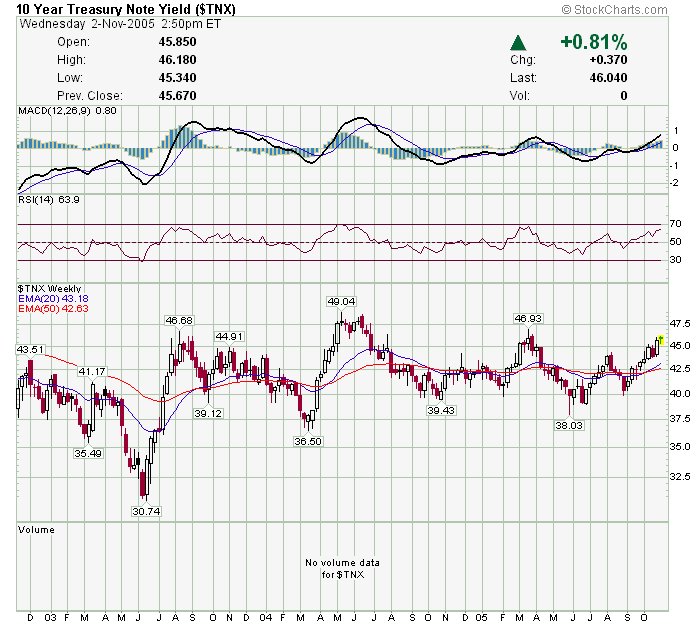
Tuesday, November 01, 2005
TAX ADVISORY COMMISION REPORTS
TRAP DOOR IS SET
http://www.taxreformpanel.gov/
10/25/2005 Tax Reform Panel Conference Call Tax Reform Panel Conference Call Today the Panel on Federal Tax Reform announced that the public teleconference call previously scheduled for Thursday, October 27th, will take place on Monday, October 31st.
Monday's Conference Call The President's Advisory Panel on Federal Tax Reform has canceled Monday's conference call.
Tax Commission to Recommend Major Changes
http://www.inc.com/criticalnews/articles/200510/tax.html
A tax advisory panel plans to recommend limits in deductions, including those from employer-paid health insurance.
By: Kevin Ohannessian
Oct. 13--The President's advisory panel on federal tax reform is scheduled to report its findings to the President on November 1st. Among the panel’s expected recommendations are an end to the controversial Alternative Minimum Tax, a limit on health insurance deductions, and caps on mortgage interest deductions.
THAT IS TODAY!!!! brudda's!!! same day as FED meeting!!! WHO indeed will be watching , who will tell us if ANY DRAMATIC changes wil be suggested, and can they pass it?
DEM'S would LOVE to see caps on home mortgage int deductions, as MOST of their constituents don't own $M houses.
TRAP DOOR is set, change in backruptcy laws, doubling of minimum credit card payments, increase in mortage debt, increases in property taxes, increases in energy costs, 70% OWN HOMES and would be adversely effected by any tax code change limiting deductions. (GEE wish you would have told me!)
Subscribe to:
Posts (Atom)
