http://prudentbear.com/creditbubblebulletin.asp Doug Noland
Fair playing field?
October 27 – Bloomberg (Shannon D. Harrington): “Derivatives traders may be profiting from inside information on leveraged buyouts and other takeovers, a study by Credit Derivatives Research LLC suggests. Credit-default swaps based on the bonds of 30 takeover targets, including four of the five biggest LBOs of 2006, rose before deals were announced or news reports said transactions were likely, according to the New York-based independent research firm.”
It’s not only the resurgent corporate debt Bubble that has me recalling 1999/2000. It was no coincidence that NASDAQ went parabolic about the time deterioration in underlying fundamentals was gathering pace. A spectacular short squeeze, flight into perceived safer corporate bonds, and liquidity creating securities/derivatives leveraging were prominent aspects of that period’s Monetary Disorder. Today, an extraordinary confluence of factors including the housing downturn, economic vulnerability, destabilizing Credit excesses being “recycled” back to U.S. securities markets, and a major shift of speculation into riskier Credits is fueling a corporate debt Bubble with a present scope and future consequences that greatly exceed anything from 1999. The tech Bubble was only a warm-up…
Dr. Issing is absolutely correct: “… Excessive liquidity world-wide is fueling asset prices and is something which has to be taken seriously by central banks.” Tonight I’ve focused on U.S. Credit system dynamics. But our massive Current Account Deficits have as well spurred lending, liquidity and speculative excess around the world. Our degraded currency has certainly unleashed systemic global Credit inflation, with profligate domestic Credit systems no longer disciplined by the (dollar-anchored) global marketplace. It’s more aptly described as “Global Wildcat Finance,” with Credit and asset inflation readily condoned by a speculating community that has come to wield incredible power and influence.
Please read entire post by Noland. ALL you have to understand is how the markets asset inflation is coming about, and like the tech bubble this will burst and be 10X worse, for now? enjoy all boats floating
Duratek (I am currently short the NAZ with stop loss previous high, which was NOT taken out Fri, and when I think any correction due is done? I am long
Saturday, October 28, 2006
SATURDAY MORNING POST
So here we are, my haven't we come a long way? Who among you thought you would see Dow above 12,000? How about that bursted housing bubble? Iraq war, deficits, stock option scandal, etc etc.
Selling pressure has melted away, giving way to a renewed bullish zeal maybe never seen, by some measures one wonders if 1982 Bull market ever ended?
Years after mid term elections are usually VERY BULLISH seldom blue. I wont take too much trying to explain it, wondering where did that 4 yr cycle low go, or how the market can gain almost every day or ignore monumental divergences and inbalances and record debt.
What we have is record earnings expansion, fueled by easy money, financials from trading and IPO'S M and A activity, a virtual frenzy.
The FED stands pat, idley by, as the market spirals up out of control and no anchor to reality. They are and have been fostering every kind of bubble and form of asset inflation, and are mainly responsable for every crisis.
I do not know where this rally goes or where it ends. AS long as traders/investors fear not (VIX 10) and money flows in not out, maybe longer than anyone predicts....or it could suddenly end without notice.
As a new high is in DOW, CRASH potential is now back on the table, the 2 CRASHES have only occurred very shortly after new highs, not well into any bear market, no near the top....this is a rare phenom.
So, maybe no news matters, it isnt all jiggy news we see, 1.6 GDP (could be lowered when revised) we have a reliable indicator, the yield curve telling us Recession is coming or here, but it is excused away.
WHat matters is enough want this market, have to be IN this market and the flow of cash is blowing away any sellers.
Is FRIDAY the top of this rally VERY short term? I think it is possible, we have VERY overbought condition daily and weekly, and I see momo divergences all over the place, but Fri was not VERY aggresive selloff, and may be over or last just a few days.
Lots of retraces back track 30% of rise, so we need to be watchful here to see what develops.
The rise VERY sharp parabolic like, when or if parabolic rise is done, it usually gets 100% retraced.
Goldilocks landing/economy? ALL I see is one asset inflation being traded for another, so this musical chairs Ponzi scheme marches on, but at some point the music will stop, no greater fool will arrive, and no one to tell those to get out that may have gotten back most or all of their bear losses, 2nd time no charm and will be horribly painful. IMHO
Duratek
Sunday, October 22, 2006
18 DAYS
VOTE DEMOCRATIC ACROSS THE BOARD FOR ANY CONGRESSIONAL OR SENATE SEAT AND SEND GEORGE BUSH A CLEAR MESSAGE: YOU CANT SCREW THE AMERICAN PUBLIC, LIE AND ABUSE THE CONSTITUTION AND GET AWAY WITH IT.
IF YOU SIT N YOUR HANDS THIS ELECTION, THEN YOU DESERVE WHAT YOU GET.
D
IF YOU SIT N YOUR HANDS THIS ELECTION, THEN YOU DESERVE WHAT YOU GET.
D
Saturday, October 14, 2006
Sat Morning POst "DAY OF RECKONING PUT ON HOLD"
I just scanned weekend L< need to read whole piece, but it seems, and with mkt action, there will be NO mkt pullback and IF the R’s hold onto majority this NOV BAMMM an EXPLPOSIVE RALLY into yr end will ensue……while many
….waiting for the OCT or other decline that never comes.
Even with record string as EWT points out of 90% plus bulls, 4 yr low no low down, 4 yrs without 10% correction…in a climate we all know is false but it creating record SPX earnings qtr after qtr after qtr……and here is L all but shouting ALL IN M’fer’s all in
*(one good thing, I found a BEAUTIFUL Japanese made Fender Jazz like new, played my friends last night on AMPEG equip all night…jamming, so nice!!!! Excited one day I will jam in front of people got long way to go) picking it up today !!!
It is now clear that 200-2003 was just correction to the MUTHA of all SECULAR BULL MARKETS!!!!! Can it be anything else? There is NOTHING that can derail it…..ANY long term MA’S you run shows it INTACT and strong, so why are we looking for its end, why NOT ALL IN??
EVEN 2 ½ year MACD divergence cant end it. Longest running Trannie/Dow non confirm cant end it, now other way around Dow new highs and trannie non confirm cant end it. Housing bubble burst cant end it. Destruction of manufacturing cant end it, record debt cant end it. BOND inversion cant end it.
Record % of income for mortgage cant end it. Negative savings rate cant end it.BLOW OUT record of total credit market debt as % of GDP cant end it.
Coming qtr probably near 1% GDP my guess cant end it? Flagging LEI’S cant end it. Record gas prices didn’t end it. $2 B a week in IRAQ Fiasco didn’t end it. STOCK OPTION SCAM didn’t end it. Loss of ENERGY earnings as leadership to record SPX earnings isn’t going to end it?
LOWER GAS and HIGHER MKT before NOV election NO ACCIDENT…………CONTRACTING ADJ MONETARY BSE cant end it.
GOLDILOCKS IT IS and I cant fight them anymore I think, I don’t have to understand how ASSET inflation one to another then another is all we need? Now a BULL that began no later than 1982 (some accts say 1974) is still gaining momentum in 2006?? Minimum length 24 years as many as 30 years.
And it is said the BEAR THAT FOLLOWS BULL is of equal length and severity/extreme……and so this is not the case to date.
Was all it was about checking just one facit of it? The techs, taken down 90% (and we wanted more?) has been accomplished. FED is invincible holding rates down to 1% a record move AND NO ONE should doubt they can fix anything?
Record trade and gov deficits cant end it?
WE all cant win in the end I KNOW that, like ANY Ponzi scheme, how is it possible we ALL make money in the stock market? WE ALL just keep putting money in for retirement, and never stop.
Historic LOW levels of Mutual fund cash can’t stop it. 8,000 wild and untethered hedge funds cant stop it.
Why not just give in to it, what sense in the worrying, what good is that. Had one only had small % in Tech going into 2000 who stayed LTBH are way ahead of the game and NEVER Lost any sleep nor had to put ONE OUNCE of time, worry or effort in to managing their accounts.
Yes to this point in time, “It is time IN the mkt, not TIMING the market” that pays off.
Now how can one argue with that?
Duratek (tired of being a bear and constantly on watch, in a world where nothing adds up and the rich get richer as lemmings buy their wares.....there is world of hurt out their for the barely haves and the nots....as the DAY OF RECKONING has been put on hold)
Friday, October 13, 2006
DATA ALERT
> http://research.stlouisfed.org/publications/usfd/page3.pdf
I dont care what
> definition you apply to this figure.....it IS contracting as of this
report,
> BELOW JAN position, we have int rate INVERSION, we have CNBC laughing off
> falling retail sales numbers....we have NOV election. WE have making of monumental top,IMHO
D
I dont care what
> definition you apply to this figure.....it IS contracting as of this
report,
> BELOW JAN position, we have int rate INVERSION, we have CNBC laughing off
> falling retail sales numbers....we have NOV election. WE have making of monumental top,IMHO
D
Friday, October 06, 2006
SEPT RICHEBACHER
A TIGHTENING FARCE
Dr. Kurt Richebächer
There is total detachment from the bad news that is pouring out of the economy. For several years, the booming housing market has made the difference between recession and recovery for the U.S. economy. Zooming house valuations provided private households with the collateral that allowed them to replace the missing income growth with a borrowing binge.
But as the housing market is sagging, this major source of higher consumer spending is plainly drying up, and most obviously and importantly, income growth is by no means catching up.
In 2005, real disposable incomes of private households in the United States increased $93.8 billion, or 1.2%, while their debts grew $1,208.6 billion, or 11.7%. Total consumer spending on goods, services and new housing accounted for 92% of real GDP growth.
The U.S. economy's recovery from the recession in 2001 has been its slowest in the whole postwar period, and in addition, it has been of a most unusual pattern. Real GDP rose by 11.7% over the four years to 2005. Within this aggregate, residential building soared by 35.6%. Consumption gained 13.4% and government spending 10%. The big laggard in domestic spending was business nonresidential investment, up only 3.6%. Net exports year for year were increasingly negative.
Most economic data have softened, with the downtrend accelerating. In the face of this fact, it could not be doubted that Mr. Ben Bernanke and most others in the Federal Reserve were anxious to stop their rate hikes. In question was only whether they would dare to do so in view of the high and rising inflation rates. They dared. They even disappointed those who had predicted the combination of a declared "pause" with hawkish remarks about fighting inflation.
In its statement, the Fed conceded:
"Readings on core inflation have been elevated in recent months, and the high levels of resource allocation and of the prices of energy and other commodities have the potential to sustain inflation pressures. However, inflation pressures seem likely to moderate over time, reflecting contained inflation expectations and the cumulative of monetary actions and other factors restraining aggregate demand."
When the Bureau of Labor Statistics (BLS) reported on Aug. 16 that the CPI in July had seasonally adjusted, advancing 0.4%, following a 2% rise in June, both the bond and stock markets responded with strong rallies. What, apparently, had made it so exciting in the eyes of the consensus was the fact that these bad figures had remained in line with distinctly unoptimistic predictions. Never mind that during the first seven months of 2006 the CPI has risen at a 4.8% seasonally adjusted annual rate, compared with an increase of 3.4% for all of 2005.
It is, of course, perfectly true that monetary tightening impacts the economy and its inflation rates with a pretty long delay. The trouble in the U.S. case is that there never was any monetary tightening. There were many small rate hikes, and the Greenspan Fed had probably hoped that the higher costs of borrowing would exert some restraint on credit demand. But it has not happened. It was a vain hope.
The fact is that the credit expansion has sharply accelerated during these two years of rate hikes instead of decelerating. During 2004, when the Fed started its rate hike cycle, total credit, financial and nonfinancial, expanded by $2,800.8 billion. In the first quarter of 2006, it expanded at an annual rate of $4,392.8 billion.
Over the two years of so-called monetary tightening, the flow of new credit has effectively accelerated by 56%. In 2005, credit growth was $3,335.9 billion. Over the whole period of rate hikes, it had steadily accelerated from quarter to quarter. Borrowers and lenders, apparently, simply adjusted to the higher rates, trusting that there would never be serious tightening.
True monetary tightening would have to show first of all in declining "excess reserves" of banks relative to their reserve requirements. These have remained at an elevated level during the rate-hike years of 2004-05.
In 1991, when the Fed tightened, credit expansion slowed sharply from $866.9 billion in the prior year to $620.1 billion. A sharp slowdown in credit expansion in 2000 to $1,605 billion also happened, from $2,044.7 billion the year before. Yet this still represented very strong credit growth in comparison with the years until 1997.
Like all central banks, the Federal Reserve has two levers at its disposal to stimulate or to retard credit and money creation. The big lever is its open market operations, buying or selling government bonds, thereby increasing the banking system's liquid reserves. The little lever consists of altering its short-term interest rate, the federal funds rate, thereby influencing the costs of credit.
It is most important to distinguish between the two instruments. True monetary tightening has to show inexorably in a slower credit expansion throughout the financial system. There is one sure way for a central bank to enforce this, and that is by curtailing bank reserves through selling government bonds.
The other lever at its disposal, as pointed out, is to influence credit costs. But the influence of the central bank on credit costs begins and ends with altering its short-term federal funds rate. During the past two years, the Fed has raised its federal funds rate from 1% to 5.25%. But long-term rates hardly budged. To the extent that borrowers shifted from the low short-term rate to the long-term rate, they encountered higher borrowing costs. But at the long end, interest rates rose less than the inflation rate.
Here are still a few other credit figures illustrating the Fed's monetary tightening since mid-2004. Total bank credit expanded, annualized, by $957.0 billion in the first quarter of 2006, against $563.5 billion in 2004. For security brokers and dealers, the two numbers were $611.3 billion, against $231.9 billion; and for issuers of asset-backed securities (ABSs), they were $663.3 billion and $322.6 billion. This is monetary tightening à la Greenspan.
Monetary tightening has one purpose: to curb credit expansion fueling the excess spending in the economy and the markets. By this measure, Greenspan's monetary tightening since 2004 has been a sheer farce. During these two years, he presided over a sharply accelerating credit boom, for which the reason is also obvious.
To equate rising short-term rates automatically with monetary tightening can, therefore, be a gross mistake. Later on, we shall explain that this is the great error of the monetarists in assessing the development in 1929 and following years. Borrowing exploded during 1927-29, despite the Fed's rate hikes, and then literally collapsed after the stock market crash.
It can be argued that rate hikes in the past have generally worked. Yes, but the central bankers of the past never forgot to tighten bank reserves. Tighter money to them meant tighter credit, and it always showed in sharply shrinking credit figures. So it also has, in the past, in the United States. But this time, the diametric opposite has happened.
There was reserve easing. Money and credit, moreover, only became significantly more expensive at the short end. All the time, there was nothing in this to slow the housing bubble and the associated borrowing binge. Rising house prices easily offset the effect of rising short-term rates.
Does this mean that the economy can continue to grow as before? No, not at all. All excesses, if not stopped, are sure to exhaust themselves over time. That is no less true for economies than for the human body. In our view, the housing bubble is finished not because credit has become tight, but because the borrowing excesses are running against natural barriers.
One such natural barrier is the affordability of housing and the limited number of greater fools who are able and willing to pay these inflated prices. At some point, excess supply will exceed demand. We read from reliable sources that in June, sale offers of existing single-family homes were up 35%, while actual sales were down 6.5% versus a year ago. So the year-over-year "excess" supply was 42.2%.
Affordability is way down, units offered for sale are way up and price appreciation has all but stopped. It is a radical change in the market situation, which, however, has so far impacted economic activity only moderately.
Past experience with housing bubbles suggests that the first effects are in the steep fall of actual sales and in the lengthening of time until sales materialize. The markets become illiquid. Until sellers capitulate and accept lower prices, it can take a long time. In this way, apparent price stability becomes increasingly treacherous over time.
Present American folklore has it that a protracted slump in house prices is impossible. Let us say for many people it is unthinkable. And that is precisely one reason why this housing bubble could go to such unprecedented excess. The little historical knowledge we have about bursting housing bubbles is from a study published by the International Monetary Fund in its World Economic Outlook of April 2003. It presents past experience in a very different light. Here are some excerpts on decisive points:
"To qualify as a bust, a housing price contraction had to exceed 14%, compared with 37% for equities. Housing price busts were slightly less frequent than equity price crashes... Most housing price busts clustered around 1980-82 and 1989-92, while equity price busts were more evenly distributed across time.
Housing price crashes differ from equity price busts also in other three important dimensions. First, the price corrections during house price busts averaged 30%, reflecting the lower volatility of housing prices and the lower liquidity in housing markets. Second, housing price crashes lasted about four years, about 11/2 years longer than equity price busts. Third, the association between booms and busts was stronger for housing than for equity prices."
An important theme running through the foregoing analysis is that housing price busts were associated with more severe macroeconomic developments than equity price busts. Coupled with the fact that housing price booms were more likely (than equity price booms) to be followed by busts, the implication is that housing price booms present significant risks. For this, the authors give the following reasons:
"Housing price busts have larger wealth effects on consumption than the equity price busts...
"Housing price busts were associated with stronger and faster adverse effects on the banking system than equity price busts... All major banking crises in industrial countries during the postwar period coincided with housing price busts.
"Price spillovers across asset classes matter, as evidenced by the fact that housing price busts were more likely associated with generalized asset price bear markets or even busts than equity price busts.
The authors then give a fourth reason, which was true in the past, but in which the situation in America today radically differs:
"Housing price busts were associated with tighter monetary policy than equity price busts, reflecting the fact that most housing price busts occurred during either the late 1970s or the late 1980s, when reducing inflation was an important policy objective. The disinflation increased the real burden of debt, which exposed inflation-related overinvestment and associated financial frailty."
Dr Kurt Richebächer
for The Daily Reckoning
www.dailyreckoning.com
TRAP IS BEING SET
*(NOTE: Money cannot be easily withdrawn from a Hedge Fund, is a trap being set in attempt to find higher returns? Amaranth investors found Eboli! Also Real Estate unlike Tech stocks of the 2000 Bubble are NOT LIQUID, escape from them as it BUSTS NOT TO EASY)
We are in zone where the SPX should find STIFF resistance, today could be pivotal day if SPX slips back below 1350 convincingly, time for a breather IMHO.
Also my technical work suggests the Q's may be nearing some kind of short term top as it has rallied for near 8 weeks. I wouldn't necessarily short in here, too crazy, but I am waiting for a pullback before adding any Q longs. My guess is a mild pullback of $1-2 bottoming near end of OCT.
Banks' love affair with hedge funds
Large banks are eager to manage their own hedge funds, despite recent blowups like Amaranth.
By Shaheen Pasha, CNNMoney.com staff writer
October 5 2006: 5:35 PM EDT
NEW YORK (CNNMoney.com) -- Hedge funds have come under fire in recent days, owing in part to the recent $6 billion Amaranth debacle. But the regulatory run-ins aren't scaring off large banks, which increasingly are turning to hedge funds as a way to create serious growth.
As increased competition for deposit growth and a flattening yield curve continues to put pressure on profits, banks are eager to attract high net-worth clients and diversify their profit stream.
And while banks like Goldman Sachs (Charts) and Morgan Stanley (Charts) have had success in their prime brokerage units, which cater in part to servicing hedge funds, analysts say the big bucks lie in the management of actual hedge fund assets.
Just look at the numbers: Hedge fund managers collect 2 percent of the assets under management regardless of the fund's profitability. If a fund shows a profit, its managers receive an additional 20 percent as a performance fee.
For the banking industry, which is concerned about dwindling profits and higher interest rates, that type of fee structure is particularly appealing, analysts said.
A no-brainer for banks
High net-worth investors continue to demand hedge-fundproducts, making it a no-brainer for banks to enter the business and meet that demand, said Dick Bove, analyst at Punk Ziegel & Co. Hedge funds are notoriously high risk but offer potentially high returns to investors - thus their appeal to wealthy bank customers.
According to industry tracker Hedge Fund Research, the U.S. hedge fund industry grew to $984 billion in assets in July - a 32 percent jump from last year. Global assets are in excess of $1.5 trillion.
"The banking industry is in the business of gathering money wherever it may exist," said Bove. "If the money now exists in hedge funds, it's incumbent on the banking industry to get into that business."
But banks are doing more than just getting in to the business. They're now becoming leaders within the hedge fund industry.
Banking titans Goldman Sachs and JPMorgan (Charts) Asset Management - through JPMorgan's majority stake in Highbridge Capital Management - are currently the largest hedge fund firms in the United States, according to a recent survey by industry magazine Absolute Return.
Goldman Sachs leads the pack with $29.5 billion in assets, while JPMorgan ranks a close second with $28.8 billion. Barclays ranks sixth with $17 billion in assets under management.
It marks an impressive leap for both Goldman and JPMorgan in just one year. In 2005, Goldman Sachs ranked third with $15.3 billion, while JPMorgan wasn't even in the top ten.
As hedge funds aren't required by any regulation to disclose their monthly returns, they're notoriously tight-lipped about their performance, and it's unclear what the banks' profits - if any - are on those assets.
But given the growth in assets under management at Goldman Sachs and JPMorgan, its little wonder other banks are looking to enter the hedge fund arena as well. Morgan Stanley, most notably, has been the subject of Wall Street rumors to the effect that the bank is in talks to acquire a hedge fund. The buzz is that such a buy would fulfill part of CEO John Mack's vision of expanding the company's alternative investments business, which includes private equity.
Still, Wall Street has long had a love-hate relationship with hedge funds. Investors love the promise of high returns, and managers love the heady fees associated with running the alternative investments.
But when a large-scale meltdown occurs - such as Amaranth's roughly $6 billion loss attributable to bad natural gas bets or, worse, the implosion of Long-Term Capital Management in 1998- the closely guarded hedge fund world suddenly becomes enemy number No. 1, raising fears of litigation and hugelosses to investors.
A risky business
Indeed, banks eager to profit from hedge funds may open themselves up to increased legal risks, warned Christopher Whalen, managing director of Institutional Risk Analytics, a financial analysis and valuation firm.
"These things are highly speculative and we're likely going to see a lot more [Amaranths] coming out of the closet," he said. "If a bank-owned hedge fund blows up, the liability trial attorneys will have a field day."
And there are no guarantees that a fund will be profitable for investors or the banks that offer them.Citigroup (Charts), for instance, has been struggling with its in-house hedge fund unit. The company invested about $1.5 billion in Tribeca Global Management and currently has about $2 billion in assets. Citigroup Alternative Investment, which includes Tribeca Global Management, has total assets of about $7.5 billion, according to Absolute Return.
But the unit lost its chief executive, Tanya Styblo Beder, after months of relatively poor returns to investorsand high expenses.
There is also concern that, after years of stellar growth, hedge funds may be in for a slowdown that could lead to consolidation. That could spell bad news for banks that enter the business now.
After starting the year with a 3.5 percent gain, the HFRI Fund Weighted Composite Index - a broad industry measure of hedge fund performance - ran into a rough patch in May, June and July. The index showed losses for those three months before rebounding modestly with a 1 percent gain in August.
The number of new funds launched has dropped, but liquidations declined apace. In the first half of 2006, 549 funds were launched and 223 liquidated. Over the same period, there were 1,211 launches and 428 liquidations.
But critics shouldn't be too quick to predict a decline in the hedge fund industry, said Josh Rosenberg, president of Hedge Fund Research. For one thing, the HFRI index is still up almost 7 percent year to date as compared to a 5.8 percent gain on the S&P 500.
Record inflows into hedge funds
And while fund launches fell from last year, the hedge fund industry is in for a record year of inflows.
Through the first half of the year, the hedge fund industry saw inflows of $66.1 billion, with the second quarter accounting for $42.1 billion of those flows - a record for a single quarter. And inflows in the first half of the year beat the $42.1 billion in inflows that the industry recorded for the full year of 2005.
"There's been quite a bit of fluctuation in performance during the course of this year but money still continues to flow into hedge funds," Rosenberg said.
And as money keeps flowing in, banks will continue to have an even stronger incentive to get in on the action.
"I don't know if banks will ever own the entire market," said Denise Valentine, senior analyst at independent consulting and research firm Celent LLC. "But it's a major trend that will continue because banks have tremendous resources both in technology and money to buy these firms."
Amaranth debacle raises cry for regulation
Shrugging off Amaranth
AUTO AND HOUSING LED THE REVIVAL, and now?
BorgWarner to cut 850 jobs, trims outlook
Auto parts maker stock dives on news; company blames cost cutting measures at Big Three automakers and higher commodity prices.
September 22 2006: 12:39 PM EDT
CHICAGO (Reuters) -- Auto parts maker BorgWarner Inc. on Friday said it would slash 13 percent of its North American work force and cut its 2006 earnings forecast, becoming the latest U.S. supplier to warn that a slump in orders from Detroit-based automakers would hurt results.
Shares of BorgWarner (down $1.72 to $52.77, Charts) fell almost 4 percent on Friday, touching their lowest level since June 2005. Shares in most other U.S. parts makers also sagged for a second consecutive day following a warning by Lear Corp.
The job cuts will cost BorgWarner a charge of 15 cents a share in the third quarter.
Several U.S. parts suppliers have warned that cuts at General Motors Corp. (down $0.49 to $30.44, Charts), Ford Motor Co. (up $0.18 to $7.94, Charts) and DaimlerChrysler AG's (up $0.05 to $50.05, Charts) Chrysler Group would hurt results, and BorgWarner is not likely to be the last, analysts said.
"Despite the short-term pressures, BorgWarner remain well-positioned for the long-term," Morningstar analyst John Novak said. "We expect more of these announcements from the large suppliers and significantly more instability in the Tier II and Tier III supply base over the coming quarters."
Job cuts by October
BorgWarner said it would cut about 850 jobs across its 19 operations in the U.S., Canada and Mexico by the end of October, citing in part, production cuts at the Big Three automakers and a rise in commodity prices, mainly the nickel used in turbochargers.
The supplier trimmed its 2006 earnings per share forecast to a range of $3.95 to $4.10, excluding 15 cents per share for restructuring, from a range of $4.35 to $4.60. Analysts on average expect $4.42 per share, before special items, according to Reuters Estimates.
Auburn Hills, Michigan-based BorgWarner sees 2006 sales at the low end of its outlook of 5 percent to 7 percent, but expects to be back on track for 7 percent to 9 percent growth in 2007.
The company supplies powertrain components, including components for all-while drive vehicles that are supplied to Chrysler and Ford. North American operations were affected by the Big 3 cuts and other customers, the company said.
More than a one-customer issue
"This is more than a 'one-customer, one product' issue," Chief Executive Tim Manganello said in a statement.
In a conference call, BorgWarner executives said the majority of the restructuring costs will be cash for employee severance taken in the third quarter with a payback to the company in 2007.
"We are trying to salvage as much of the fourth quarter as we can and position ourselves to be in a better position starting with the first of the year 2007," Manganello said on the conference call.
All of the traditional Detroit-based car companies have taken cost-cutting steps in response to slowing sales for pickup trucks and sport utility vehicles, an area of the market they have dominated.
GM and Ford are closing more than two dozen plants and cutting over 75,000 jobs. Chrysler said earlier this week it was cutting current-quarter production by 24 percent to reduce inventory of slow-moving trucks and SUVs.
Chrysler has said it is considering other cost-cutting steps as well.
BorgWarner's cuts are similar to North American restructuring efforts by Johnson Controls Inc. (down $1.13 to $68.06, Charts) and Lear, J.P. Morgan analyst Himanshu Patel said in a note.
Patel expects more warnings in coming weeks from large U.S. suppliers, naming American Axle & Manufacturing Holdings Inc., Visteon Corp., Johnson Controls, ArvinMeritor Inc. and Gentex Corp. as most at risk.
Lear on Thursday warned that U.S. carmakers' production cuts would hurt results, which followed warnings by suppliers TRW Automotive Holdings Inc. and Navistar International Corp.
Thursday, October 05, 2006
Market Poised To Go Higher
Small and Mid Caps are beginning to heat up and the NAZ has been steadily gaining, in what appears to be an acceleration of the rally.
Oct up to this point appears to be a pussycat, not a bear. The bear is being put to death. The animal spirits will run wild until they duplicate 2000 bubble euphoria.
Falling gas and inflation fears fueling the run, as well as goosing by those who want to see the Repub's maintain status quo. We are however probably putting in a multi year high, with avg Bull market lasting around 4 years, this is one will be in matter of days from OCT 2002 lows.
The market has come all this way without a 10% correction, rather rare, and it has been a record setter for more than 4 yrs of bullish plurality.
There remains too much bearish sentiment however and predictions of a selloff in OCT that has yet to appear, and likely will not.
But make no mistake about it, no matter how high we march, this IMHO is the ending move from the 2002 lows to complete this bull market.
Once a trend gets going it is hard to stop until it exhausts itself. I see no exhaustion here.
The market should correct soon, maybe next week, for now I don't expect it to amount to much.
NO, I am not chasing this last piece, and I would be on guard for any blowoff move or early strong up day that reverses to red.
Energy may have bottomed short term, USO PTEN VLO XLE put in solid days, I think more downside is possible.
PGH is yielding near 14% as an energy trust.
Watch Transports to see if they can better their 2006 double top, for now we have a Dow Theory non confirmation in place.
D
Wednesday, October 04, 2006
FALLING RATES CAN ONLY DO SO MUCH
Falling mortgage rates can do only so much
Lower rates will help buyers stretch -- but there are other forces pushing down real estate prices.
By Les Christie, CNNMoney.com staff writer
September 26 2006: 2:15 PM EDT
NEW YORK (CNNMoney.com) -- Low mortgage rates were a big factor driving the housing boom of the past few years and their climb was expected to play a big role in the market's undoing.
But now rates are sliding again - is it time to breathe a sigh of relief?
The slowing process has already begun: Not only are inventories up and sales down, but, for the first time in more than 10 years, average home prices have actually gone down over a 12-month period.
Rates have dropped from July highs of about 6.79 percent for a 30-year fixed mortgage to 6.40 percent last week, according to Freddie Mac. That, however, is still higher than a year ago, when they were 5.8 percent.
Since mid-2001, the average 30-year, fixed-rate mortgage has rarely exceeded 7 percent. Rates bottomed out at 5.2 percent in June 2003.
Rates have a direct impact on monthly payments - the lower the rate, the lower the payment - and therefore on how much home a buyer can afford. Ellen Bitton, founder of the Park Avenue
Mortgage Group, says today's lower fixed-rate mortgages have the potential to lift the market, because markets often run on emotion.
"[Lower rates] make people more optimistic," says Bitton. "The markets may not go all gangbusters again, but overall, they're good for the business."
Joel Rassman, the chief financial officer for homebuilder Toll Brothers (TOL (Charts)), agrees the lower interest rates have a "positive effect on the psychology of buyers." And, he points out, there is significant pent-up demand for housing that low interest rates could help free up.
The impact on falling rates, however, will depend on the market. Dianne Saatchi, vice president with the Corcoran Group, a New York based real estate broker, thinks declining rates will have little impact on her buyers. "The mortgage rates never got very high. They're still, looking at the last 30 years, outrageously low."
Allen Hardester, a senior executive with a Maryland-based lender, Hyland Financial Services, says most of the demand for homes is in the affordable price range - $200,000 to $300,000 - and that's where lower interest rates will help. Many buyers are stretching the limits of their budgets. Lower interest will make those limits a bit more elastic.
But in Hardester's opinion, even if rates do drop further, it may not be enough to offset another factor that was a feature of the boom - the decline speculative investing. NAR reported that 40 percent of all home sales in 2005 were purchased primarily for investment (28 percent) or for second homes (12 percent).
Many of those speculators have stopped buying. Some have even put their properties on sale, helping to fuel the inventory glut (see table). There were 3.9 million homes on the market in August, up 38 percent from a year earlier.That will work against sellers trying to keep prices from falling further.
In addition, interest on adjustable rate mortgages, which added lots of fuel to some of the nation's hottest housing regions, have not returned to the very low levels they hit in 2003, when a one-year ARM could be had for 3.40 percent, or less. That's more than 2 percentage points below where they are now.
Neil Garfinkel, a real estate and banking law attorney with Abrams Garfinkel Margolis Bergson, LLP, says the current mortgage rates are merely keeping a tough real estate market from getting worse. "I think that if anything has saved the market, it's the low interest rates. Consumers have been gun shy. They hear about bubbles and what disaster is going to happen. If interest rates had shot through the roof it would have been a big problem."
Tuesday, October 03, 2006
OIL SLICK and JIGGY DOW
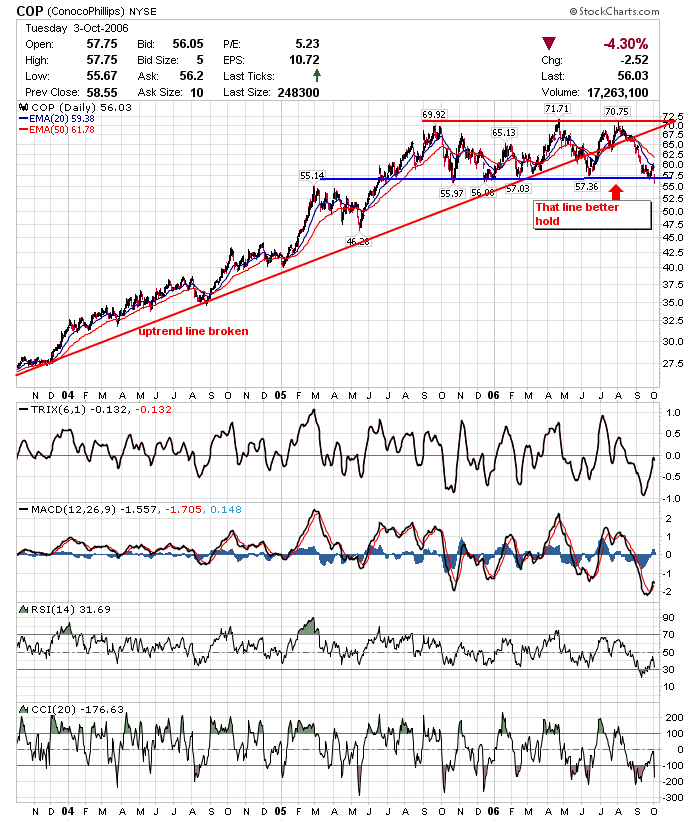
Click to enlarge, then click again in lower right corner for orig size.
COP briefly below long standing support line as I have drawn, and another down day dooms it to close beneathe it.
Oil on the NYmex $58.70 as we speak, why the tumble? Even as fears and threats of production cutbacks come from some OPEC members, did not support price today!
Oil rose with stocks as did gold, and commodities in general, as demand grew with economy, so now as commodities PLUMMET and stocks still head upward this is seen as BULLISH development. Consumers will HAVE MORE MONEY IN THEIR POCKET to spend on frivalous items.
Don't mention that it takes 30-50% of their income to rent or buy orthat MANY things cost more now, not just gas for the auto.
Housing is coming in for a soft landing? maybe so, but Home Depot etc are laying off, CHallenger reported today 100K job cuts announced some 40% above recent stats. We are JUST feeling the fallout from the housing slump would be bubble that popped.
WHO is talking about how much oil and energy companies were adding to the huge SPX profits being reported? Stocks should fly as earnings momentum is taking blows to the head?
Even with pullback in rates recently many mortgages are being reset and going up substantially, more than the measley $10 per fill the drop in gas is associated with.
Did you know as the DOW was making its run today at a NEW ALL TIME CLOSING HIGH that the volume of stocks declining was greater than those rising?
http://finance.yahoo.com/marketupdate/overview according to YHOO FINANCE we had 51% down volume!!! does that strike you as odd?
My take is that we are ever narrowing the amount of stocks participating in this rally and this is NOT a bullish development IMHO
This MUST change or the market will surprise many, for now who is worried with new high that it isnt going to continue?
Anything is possible, all we can is look at probabilities, and in my mind, as each leadership group has come forward and then gotten CRUSHED, I will take my 5% CD's and 4.5% CASH MM'S and call it a day.
The next move to surprise is coming to the Bear side. IMHO
Duratek
AM BOOTY CALL
Job cuts top 100,000 in September
Survey shows planned layoffs driven by softness in automotive, housing sectors.
October 3 2006: 7:58 AM EDT
NEW YORK (CNNMoney.com) -- The U.S. labor market showed increasing signs of weakness last month as the number planned job cuts topped 100,000 in September, according to a report released Tuesday.
The survey, published by the global outplacement consultancy group Challenger, Gray & Christmas, revealed that planned job cuts reached 100,315 last month, up 54 percent from August and up 40 percent from the same period last year.
"The top reason provided by job-cutting employers during the month was a downturn in demand," said John A. Challenger, chief executive officer of Challenger, Gray & Christmas. "We probably would not see permanent job cuts if the downturn were considered temporary."
While planned job cuts soared in September, layoffs are still down 18 percent so far this year, compared to the same nine-month period in 2005.
Challenger, Gray & Christmas said the majority of payroll cutting came from the automotive sector, which announced 33,745 cuts, while suppliers to automakers Ford (Charts), General Motors (Charts) and DaimlerChrysler (Charts) were particularly hard hit.
Softness in the housing sector has sparked job cuts at the home improvement retailer Home Depot (Charts) and homebuilder Pulte Homes (Charts), according to the survey, while both the telecommunications, computer industry and consumer product companies all reported more planned job cuts last month.
September typically marks the start of the heaviest job-cutting part of the year, Challenger said, noting that he would not be surprised if another 30,000 cuts were announced before the end of the year.
http://money.cnn.com/2006/10/03/news/economy/housing_costs/index.htm
HOUSING A BURDON
Duratek OCT will be OCT
Subscribe to:
Posts (Atom)
