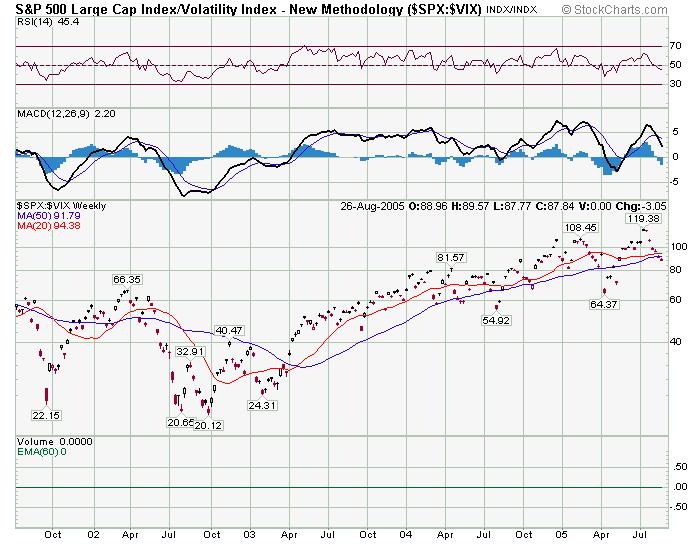
I am about the only person you will read who mentions this indicator.
I use a 20 and 50 week moving average here. LOOK how nicely the passing upward of the faster 20 wk thru the 50 wk signalled a BUY signal? How would you have faired if you followed this signal? YES.
Notice how so far, the 20 wk has managed to stay above the 50 wk? We could say that so far the trend has not been changed according to this, for now just a correction taking place.
But this is the closest the 20 has been to the 50 since its breakout, and the 2 lines are converging.
What do you think a decided breakdown of the 20 down the 50 would signal? If it was good enough for a BULL sighting, why not good enough for bear sighting? As long as it declined and stayed below the 50 wk?
Notice how both 20 and 50 wk have been rising in paralell.
If we see the reverse of this, should we not get VERY defensive? SHould we not assume Phase II of Bear Market is game on?
These are my observations and opinions, I hope you find the posting of these charts helpful as I try and master my blogs capabilities.
In 2002 there was a premature rise above 50wk, but 50 wk was still declining. In 2003 we got a divergence when the ratio made a higher low as did the SPX 500.SHortly thereafter the 20wk did its crossover thing.
We could have added other confirming TA to assist us, and should have NOT gone all in, but began to avg in our money.
I am premature perhaps looking for decline, the SPX/VIX ratio will help define my caution, and it is getting VERY close to doing so!
Duratek

No comments:
Post a Comment