EVEN after 5 years from bubble burst MORE job cuts, the way to profits hasn't changed
D
Friday, July 15, 2005


Thursday, July 14, 2005
HOLY GUANO BATMAN!
AN OUT and OUT COLLAPSE! WHAT is this saying about the world economy?
BDI BLOG TALK trans talk
WHAT is BDI?
Duratek
BDI BLOG TALK trans talk
WHAT is BDI?
Duratek
THIS CHART TELLS IT ALL
NET BIRTH DEATH DATA JULY takes away, Aug will add, then not much there after.
Than as you can see in JAN, they TOOK BACK 280,000 jobs to "even up" the books.
SAD, very SAD
Duratek, searching for the truth will set you free.....and maybe lead to drink!
Than as you can see in JAN, they TOOK BACK 280,000 jobs to "even up" the books.
SAD, very SAD
Duratek, searching for the truth will set you free.....and maybe lead to drink!
IMPORTANT TNX UPDATE
TNX CHART link below
New low had a rather neutral showing in ROC and MACD. Lower BB and upper BB have been playing YOYO with moving price. Coincidence the 50 week SMA is 4.197 and today's high was 4.196 ??!! Do you love that?
Weekly MACD is about to give BUY signal on HIGHER YIELDS with crossover and histograms going positive. ROC has turned up.
My guess is with 50 SMA now declining, if we do get above 50 wk SMA, the rally will last until we get near upper BB and end somewhere near previous high.
This should occur right before the next monthly JOBS DATA which I think wil NOT have the manipulated NET BIRH DATA so positive (looking at trend) to give the appearence of healthy job growth.
Bonds will quickly rally, stocks will sharply decline, somewhere between now and then will be LAST great buying opps for bonds IMHO.
New low had a rather neutral showing in ROC and MACD. Lower BB and upper BB have been playing YOYO with moving price. Coincidence the 50 week SMA is 4.197 and today's high was 4.196 ??!! Do you love that?
Weekly MACD is about to give BUY signal on HIGHER YIELDS with crossover and histograms going positive. ROC has turned up.
My guess is with 50 SMA now declining, if we do get above 50 wk SMA, the rally will last until we get near upper BB and end somewhere near previous high.
This should occur right before the next monthly JOBS DATA which I think wil NOT have the manipulated NET BIRH DATA so positive (looking at trend) to give the appearence of healthy job growth.
Bonds will quickly rally, stocks will sharply decline, somewhere between now and then will be LAST great buying opps for bonds IMHO.
Duratek
FLAT YIELD CURVE AIN'T WHAT it used to be, ain't what it used to be....
Old conundrum, new twist
Inverted or flat, the yield curve points to a weaker Federal Reserve, not a downturn.
July 14, 2005: 2:41 PM EDT By Katie Benner, CNN/Money staff writer
NEW YORK (CNN/Money) - When bond yields compete with Martha Stewart and Bernie Ebbers for headlines, they usually lose. But recently they've gotten attention by behaving in a way that has sparked fears of a big economic slowdown.
That's because the yield curve has been flattening. The graph of bond yields in the Treasury market usually slopes upward, with yields on longer-term bonds higher than shorter maturities.
Some experts even say there's a decent chance the curve may soon invert -- an event that has preceded the nation's last two recessions. (Confused about yield curves? Click here for help.)
Federal Reserve Chairman Alan Greenspan is worried, too, calling the persistence of low long-term rates a conundrum.
He and other Fed policy-makers have raised a key, short-term interest rate, the fed funds overnight bank lending rate, to 3.25 percent from 1 percent just over a year ago, as the central bank tries to ward off inflation, and cool off the housing market, while it keeps economic growth on track. (Full story.)
But while short-term rates have risen, long-term rates, which are set by the markets, haven't followed suit. In fact, the yield on the 10-year Treasury is about half a point lower than it was last June.
That, in turn, has helped keep mortgage rates low, since home loan rates track the long-bond rate. And some, including Greenspan, have begun to worry that the red-hot housing market may overheat. (Full story.)
Analysts said the Fed's power to influence long-term Treasury and mortgage rates has been clearly diminished by a number of factors -- most notably low inflation worldwide and the growing clout of foreign central banks on U.S. rates through their purchases of Treasury bonds.
Investors usually sell Treasuries on signs of economic strength, or when short-term rates start rising, as they bet that long-term rates will eventually rise along with inflation. (Bond prices and yields move in opposite directions).
But most bond investors and economists say the 10-year yield probably won't rise much further this year -- even though the Fed probably isn't through raising short-term rates.
And while that will leave the yield curve flat, or perhaps inverted, some experts are saying the curve is not as good a recession predictor as it once was.
"It's not inaccurate to say that Fed concerns about bond yields have been overdone," said Steve Rodosky, vice president at Pacific Investment Management Co. (PIMCO), one of the world's biggest bond investors.
Low inflation: bonds party on
One big reason long bond yields have stayed low is that inflation has remained remarkably quiet, even with strong economic growth and record high oil prices.
Measured by the Consumer Price Index, the government's main inflation gauge, inflation was running at about 3.6 percent a decade ago, but that's been closer to 2 percent over the past five years, said Anthony Crescenzi, chief bond market strategist at Miller, Tabak & Co., an institutional brokerage. (The latest reading on June CPI shows inflation is tame. Click here for the full story.)
"We've had growth without inflation, said Crescenzi. "And every time the Fed raises rates it enhances its reputation as an inflation fighter," he said, noting that the central bank has convinced many bond investors that it's out in front on the fight against inflation.
As a result, he thinks the average yield on the 10-year Treasury will end the year at about 4.25 percent, just below the average for 2004.
"At the end of the day, if Greenspan wants to solve the conundrum of low long-term yields, then raising the fed funds rate is not the answer," said John Derrick, who handles $570 million in fixed income investments for U.S. Global Investors. "[Raising short-term rates] gives the long bond more staying power," he added.
Outsourcing the Fed
Then there's another school of thought that says the march of globalization has eroded the Fed's influence over long-term rates.
"Globally, the U.S. and some emerging markets are the leading growth engines," said John Herrmann, director of economic commentary at Cantor Fitzgerald, one of the world's top Treasury bond brokers.
And with growth slow in Europe and Asia, and rates relatively low worldwide, Treasuries have become unusually attractive for overseas investors -- for yield as well as perceived safety.
So the stronger the U.S. economy becomes relative to Europe and Japan, the lower long-term bond yields could fall as foreign banks keep snapping up Treasuries, analysts said.
Underscoring this point: foreign banks now own far more Treasury securities than the Fed, at about $1.1 trillion versus $738 billion for the central bank, according to Grant's Interest Rate Observer.
As the current state of affairs persists, the link between low long-term yields, a yield curve inversion and a possible recession becomes less clear.
"We buy foreign-made goods that are inexpensive and those countries plug our deficit by buying U.S. securities," PIMCO's Rodosky said. "Everyone playing that game wants to perpetuate that cycle because it is benefiting them."
To find out why Cantor Fitzgerald predicted an inverted curve, click here.
To read why Cantor said the curve may not happen, click here.
For more on the yield curve, click here.
To see what bonds are doing today, click here.
And for bond market charts, click here.
Inverted or flat, the yield curve points to a weaker Federal Reserve, not a downturn.
July 14, 2005: 2:41 PM EDT By Katie Benner, CNN/Money staff writer
NEW YORK (CNN/Money) - When bond yields compete with Martha Stewart and Bernie Ebbers for headlines, they usually lose. But recently they've gotten attention by behaving in a way that has sparked fears of a big economic slowdown.
That's because the yield curve has been flattening. The graph of bond yields in the Treasury market usually slopes upward, with yields on longer-term bonds higher than shorter maturities.
Some experts even say there's a decent chance the curve may soon invert -- an event that has preceded the nation's last two recessions. (Confused about yield curves? Click here for help.)
Federal Reserve Chairman Alan Greenspan is worried, too, calling the persistence of low long-term rates a conundrum.
He and other Fed policy-makers have raised a key, short-term interest rate, the fed funds overnight bank lending rate, to 3.25 percent from 1 percent just over a year ago, as the central bank tries to ward off inflation, and cool off the housing market, while it keeps economic growth on track. (Full story.)
But while short-term rates have risen, long-term rates, which are set by the markets, haven't followed suit. In fact, the yield on the 10-year Treasury is about half a point lower than it was last June.
That, in turn, has helped keep mortgage rates low, since home loan rates track the long-bond rate. And some, including Greenspan, have begun to worry that the red-hot housing market may overheat. (Full story.)
Analysts said the Fed's power to influence long-term Treasury and mortgage rates has been clearly diminished by a number of factors -- most notably low inflation worldwide and the growing clout of foreign central banks on U.S. rates through their purchases of Treasury bonds.
Investors usually sell Treasuries on signs of economic strength, or when short-term rates start rising, as they bet that long-term rates will eventually rise along with inflation. (Bond prices and yields move in opposite directions).
But most bond investors and economists say the 10-year yield probably won't rise much further this year -- even though the Fed probably isn't through raising short-term rates.
And while that will leave the yield curve flat, or perhaps inverted, some experts are saying the curve is not as good a recession predictor as it once was.
"It's not inaccurate to say that Fed concerns about bond yields have been overdone," said Steve Rodosky, vice president at Pacific Investment Management Co. (PIMCO), one of the world's biggest bond investors.
Low inflation: bonds party on
One big reason long bond yields have stayed low is that inflation has remained remarkably quiet, even with strong economic growth and record high oil prices.
Measured by the Consumer Price Index, the government's main inflation gauge, inflation was running at about 3.6 percent a decade ago, but that's been closer to 2 percent over the past five years, said Anthony Crescenzi, chief bond market strategist at Miller, Tabak & Co., an institutional brokerage. (The latest reading on June CPI shows inflation is tame. Click here for the full story.)
"We've had growth without inflation, said Crescenzi. "And every time the Fed raises rates it enhances its reputation as an inflation fighter," he said, noting that the central bank has convinced many bond investors that it's out in front on the fight against inflation.
As a result, he thinks the average yield on the 10-year Treasury will end the year at about 4.25 percent, just below the average for 2004.
"At the end of the day, if Greenspan wants to solve the conundrum of low long-term yields, then raising the fed funds rate is not the answer," said John Derrick, who handles $570 million in fixed income investments for U.S. Global Investors. "[Raising short-term rates] gives the long bond more staying power," he added.
Outsourcing the Fed
Then there's another school of thought that says the march of globalization has eroded the Fed's influence over long-term rates.
"Globally, the U.S. and some emerging markets are the leading growth engines," said John Herrmann, director of economic commentary at Cantor Fitzgerald, one of the world's top Treasury bond brokers.
And with growth slow in Europe and Asia, and rates relatively low worldwide, Treasuries have become unusually attractive for overseas investors -- for yield as well as perceived safety.
So the stronger the U.S. economy becomes relative to Europe and Japan, the lower long-term bond yields could fall as foreign banks keep snapping up Treasuries, analysts said.
Underscoring this point: foreign banks now own far more Treasury securities than the Fed, at about $1.1 trillion versus $738 billion for the central bank, according to Grant's Interest Rate Observer.
As the current state of affairs persists, the link between low long-term yields, a yield curve inversion and a possible recession becomes less clear.
"We buy foreign-made goods that are inexpensive and those countries plug our deficit by buying U.S. securities," PIMCO's Rodosky said. "Everyone playing that game wants to perpetuate that cycle because it is benefiting them."
To find out why Cantor Fitzgerald predicted an inverted curve, click here.
To read why Cantor said the curve may not happen, click here.
For more on the yield curve, click here.
To see what bonds are doing today, click here.
And for bond market charts, click here.
A TOP IS NEAR?
NDX CHART Notice area of ROC, getting extreme here, getting extreme.
A ZUTZ off of IPOD sales, wonderful. The REAL business world away from strictly consuming I KEEP hearing, is a flat world to down....and SOONER or lATER the markets will reflect this.
The late comer lemming bear must be dealt with first. Correcting skew in CPC IMHO is needed, we are headed lately in right direction.
1% APPLE zutz, while not super impressive has moved the NDX above previous high, but 1600 looms as good resistance IMHO
D
A ZUTZ off of IPOD sales, wonderful. The REAL business world away from strictly consuming I KEEP hearing, is a flat world to down....and SOONER or lATER the markets will reflect this.
The late comer lemming bear must be dealt with first. Correcting skew in CPC IMHO is needed, we are headed lately in right direction.
1% APPLE zutz, while not super impressive has moved the NDX above previous high, but 1600 looms as good resistance IMHO
D
RALLY HAS LEGS?
http://www.briefing.com/Silver/Calendars/EconomicCalendar.htm
Strong retail sales, cool inflation (as depicted by CPI) and reaction in futures pits = extension to rally....and it looks like today will be one of those days with a flag pole, up straight from the get go, lots of buying sellers covering, never looking back....hard up into close.
This may lead into a rally that lasts well into AUG, making believers of the ones who are not, and maybe bringing down one of the last bearish holdouts I talked about last night, the put call ratio which better reflects the extreme optimism normally found at THE TOPS.Bringing this up JUST to the 2005 JAN highs we saw out of the gate, would not be good enough.
Remember, the DATA we now see is a month old, the MARKET is suppose to see into the future....6 months or so.SO we have some extreme readings of bullishness, decades lows in the VIX (VXO)new highs for SPX/VIX ratio surpassing old bull, yet we are far below that previous top....go figure.
Now, I'm all for having fun, and those long may choose to stay there and ride this up, but I feel too late in this cycle for me to do so, unless a special opp comes along.....like a dying quail DWA or something worth a play.
It seems like what is goos is known, we shall see how far the IPOD (mkt saturation?) and AMD (not a profit story) can take us, time for NAZ (laggard yesterday) to lead the way perhaps.Though I don't see what could put a pause in this today, market will always surprise.
CPC this AM a heady .50 (what Is ggested may now come to pass)
NDX busting out of upper Bollinger Band, and now overbought, some kind of reversal should not be far off. NO change iN VIX so far but SPX/VIX making another high.
Shorting DANGEROUS business, if pessimistic, most better off on sidelines. Being right and early is just as bad as being wrong.
Will the up move exhaust itself today....up up and away! LOL
Duratek
Strong retail sales, cool inflation (as depicted by CPI) and reaction in futures pits = extension to rally....and it looks like today will be one of those days with a flag pole, up straight from the get go, lots of buying sellers covering, never looking back....hard up into close.
This may lead into a rally that lasts well into AUG, making believers of the ones who are not, and maybe bringing down one of the last bearish holdouts I talked about last night, the put call ratio which better reflects the extreme optimism normally found at THE TOPS.Bringing this up JUST to the 2005 JAN highs we saw out of the gate, would not be good enough.
Remember, the DATA we now see is a month old, the MARKET is suppose to see into the future....6 months or so.SO we have some extreme readings of bullishness, decades lows in the VIX (VXO)new highs for SPX/VIX ratio surpassing old bull, yet we are far below that previous top....go figure.
Now, I'm all for having fun, and those long may choose to stay there and ride this up, but I feel too late in this cycle for me to do so, unless a special opp comes along.....like a dying quail DWA or something worth a play.
It seems like what is goos is known, we shall see how far the IPOD (mkt saturation?) and AMD (not a profit story) can take us, time for NAZ (laggard yesterday) to lead the way perhaps.Though I don't see what could put a pause in this today, market will always surprise.
CPC this AM a heady .50 (what Is ggested may now come to pass)
NDX busting out of upper Bollinger Band, and now overbought, some kind of reversal should not be far off. NO change iN VIX so far but SPX/VIX making another high.
Shorting DANGEROUS business, if pessimistic, most better off on sidelines. Being right and early is just as bad as being wrong.
Will the up move exhaust itself today....up up and away! LOL
Duratek
PROFIT WARNINGS DOWN
This may be for several reasons.
Also watch SBL this AM, Cramer was out of his shoes a sweating frenzy calling it buy last night on his hypster program.
Also watch SBL this AM, Cramer was out of his shoes a sweating frenzy calling it buy last night on his hypster program.
Wednesday, July 13, 2005
CHARTS TO MAKE YOU PONDER
Study these charts.
Approaching 2001/2002 highs RSI WEEKLY oversold, but strong uptrend intact. 2 long term avg's rising on top of each other.
TRAN MACD and RSI looking weak on the weekly chart, if 52 week closes below 90 week, I think we would have some trouble, the 52 week has provided the support so far. AN exponential 52 week, taking into account the go nowhere 2005 has begun to flatten.
DOW is sickly and offers a different view. from 2003 we see decending tops of RSI and MACD, not a healthy picture. INSTEAD of looking like the rise from 1995, it looks more like 1999 !!!! AM I wrong?
A NEW HIGH surpassing its rise into 2000 !!
Approaching 2001/2002 highs RSI WEEKLY oversold, but strong uptrend intact. 2 long term avg's rising on top of each other.
TRAN MACD and RSI looking weak on the weekly chart, if 52 week closes below 90 week, I think we would have some trouble, the 52 week has provided the support so far. AN exponential 52 week, taking into account the go nowhere 2005 has begun to flatten.
DOW is sickly and offers a different view. from 2003 we see decending tops of RSI and MACD, not a healthy picture. INSTEAD of looking like the rise from 1995, it looks more like 1999 !!!! AM I wrong?
A NEW HIGH surpassing its rise into 2000 !!
NDX MACD has near flat lined since 2002 lows and first crest. ARE WE putting in WEAK right should of MASSIVE head and shoulders formation?
We are there! the downward trendline formed from 2000 high to 2005 high. Unlike FTSE, the merge of the 52 week into 90 week not a welcome sight! BOTH are flattening, unlike RISING FTSE averagess.
It helps to STEP AWAY from daily grind and see what is really happening.......IMHO
A low in VXO (VIX old formula) not seen since 2005?!!
HOWEVER, this is NOT BEARISH, we MUST keep open mind. I am talking about "trend
of put call ratio, it was trending DOWN into 1999/2000 tops, WHO thought it would EVER end? It is now trending up! This is at odds with VXO/VIX and SPX/VIX ratio's which ALSO are used to depict complacency or pessimism and are at extremes.
Only thing I can say is possibly after CRASH of markets from the bubble highs, to the lows, there IS pesimism about current rally. BUT, PUTS are DIRT CHEAP as shown by VIX readings...a CONUNDRUM?
And rallies on lower volume than declines.
OK last look, have you REALLY looked at every chart? CPC has moved lower since 2005 top, what me worry? We are looking at shorter moving averages. STILL, LOOK where 10 week avg was at 2000 top BELOW .50 !!! YIKES!!! This keeps bulls warm at night I think.
I don't know if this ONE THING, the rising put call ratio will be an issue or not....but it is there to consider along with HIGH VALUATIONS and LOW DIVIDEND YIELDS> how will it all get rectified?
Duratek
AAPLE A DAY
Apple Reports Third Quarter ResultsWednesday July 13, 4:30 pm ET
Apple Delivers Record Revenue & Earnings
CUPERTINO, Calif., July 13 /PRNewswire-FirstCall/ Apple® today announced financial results for its fiscal 2005 third quarter ended June 25, 2005, reporting the highest revenue and earnings in the Company's history. Apple posted a net quarterly profit of $320 million, or $.37 per diluted share, and revenue of $3.52 billion. These results compare to a net profit of $61 million, or $.08 per diluted share, and revenue of $2.01 billion in the year- ago quarter, and represent revenue growth of 75 percent and net profit growth of 425 percent. Gross margin was 29.7 percent, up from 27.8 percent in the year-ago quarter. International sales accounted for 39 percent of the quarter's revenue.
Apple shipped 1,182,000 Macintosh® units and 6,155,000 iPods during the quarter, representing 35 percent growth in Macs and 616 percent growth in iPods over the year-ago quarter.
"We are delighted to report Apple's best quarter ever in both revenue and earnings," said Steve Jobs, Apple's CEO. "The launch of Mac OS X Tiger has been a tremendous success, and we have more amazing new products in the pipeline."
"We're very pleased to report 75 percent revenue growth and a 425 percent increase in net income," said Peter Oppenheimer, Apple's CFO. "Looking ahead to the fourth quarter of fiscal 2005, we expect revenue of about $3.5 billion and earnings per diluted share of about $.32."
**WOW!! IPODS have been FLYING off the shelf, stock right has been ALL OVER THE PLACE AH, now near unchanged. Growth FLAT for next qtr may be reason.
It isn't the NOW anymore in the what can you do for me tomorrow world....as the markets always look ahead.
NAZ was obvious laggard today, market needs the HIGH BETA stuff to fly.
D
Apple Delivers Record Revenue & Earnings
CUPERTINO, Calif., July 13 /PRNewswire-FirstCall/ Apple® today announced financial results for its fiscal 2005 third quarter ended June 25, 2005, reporting the highest revenue and earnings in the Company's history. Apple posted a net quarterly profit of $320 million, or $.37 per diluted share, and revenue of $3.52 billion. These results compare to a net profit of $61 million, or $.08 per diluted share, and revenue of $2.01 billion in the year- ago quarter, and represent revenue growth of 75 percent and net profit growth of 425 percent. Gross margin was 29.7 percent, up from 27.8 percent in the year-ago quarter. International sales accounted for 39 percent of the quarter's revenue.
Apple shipped 1,182,000 Macintosh® units and 6,155,000 iPods during the quarter, representing 35 percent growth in Macs and 616 percent growth in iPods over the year-ago quarter.
"We are delighted to report Apple's best quarter ever in both revenue and earnings," said Steve Jobs, Apple's CEO. "The launch of Mac OS X Tiger has been a tremendous success, and we have more amazing new products in the pipeline."
"We're very pleased to report 75 percent revenue growth and a 425 percent increase in net income," said Peter Oppenheimer, Apple's CFO. "Looking ahead to the fourth quarter of fiscal 2005, we expect revenue of about $3.5 billion and earnings per diluted share of about $.32."
**WOW!! IPODS have been FLYING off the shelf, stock right has been ALL OVER THE PLACE AH, now near unchanged. Growth FLAT for next qtr may be reason.
It isn't the NOW anymore in the what can you do for me tomorrow world....as the markets always look ahead.
NAZ was obvious laggard today, market needs the HIGH BETA stuff to fly.
D
DWA et al
LIONS GATE
I think DWA is washed out sold, my only hesitation is the SEC probe, IS IT already in the slaughtered stock? IS for DWA all the bad news out, or IN there?
D
I think DWA is washed out sold, my only hesitation is the SEC probe, IS IT already in the slaughtered stock? IS for DWA all the bad news out, or IN there?
D
INFLATION LEADS TO DEFLATION
MISES ARTICLE
Now I also see GOV is "touting" falling budget deficits, LOL. Surely THESE DO NOT nor have they EVER included cost of IRAQ INVASION!!
And it wouldn't surprise me if the figures are "ESTIMATES" based on the 2002- 2005 recovery like that of the tax receipts leading into 2000 caused EXTROADINARY miscalculations and errant assumptions going forward the next 10 years.
And I am sure the deficits we will actually end up with will pale with what we are told they will be.
All this happening under the umbrella of the BUSH 10 yr tax cuts, what is one to think?
Duratek
Now I also see GOV is "touting" falling budget deficits, LOL. Surely THESE DO NOT nor have they EVER included cost of IRAQ INVASION!!
And it wouldn't surprise me if the figures are "ESTIMATES" based on the 2002- 2005 recovery like that of the tax receipts leading into 2000 caused EXTROADINARY miscalculations and errant assumptions going forward the next 10 years.
And I am sure the deficits we will actually end up with will pale with what we are told they will be.
All this happening under the umbrella of the BUSH 10 yr tax cuts, what is one to think?
Duratek
MORNINGS DATA COMMENTS
http://www.briefing.com/Silver/Calendars/EconomicCalendar.htm
Does this look like inflation to you? There is NO foundation for a further rise in gold and silver based on this data IMHO.
Now certainly we have had asset inflation, but it is SEGREGATED, on a narrow defined area.
HAS higher OIL worked its way into the equation? What was different in the 70's when gold got near $900? No tech stocks to siphon off volume, BONDS offered screaming yields, we had a FED that reacted promptly to the inflation threat, we had TOO MUCH MONEY CHASING TOO FEW GOODS.....that is the essence of inflation gold is not going to see anytime soon.....NOT with CHINESE production seemingly limitless.
Not with 6 new dollars printed for each one that existed prior to the last 40 months, with historical easy money, with housing going thru the roof, higher oil prices etc, we don't even have a NEW HIGH for gold in 2005!
Now I'm not dissing gold, I am pointing out we have a BLACK HOLE that is sucking up all this liquidity without a marked pick up in inflation, in at least the way it is beiing presented, perhaps a whole other discussion on manipulated data! Hedonic BS seasonally adjusted hooga booga.
Surely in my business I keep getting 4% increase here, and there, but "back then" I would get 10% increases which is like 15% increases now or more.
A 50% retrace of the dollar loss from high bring us back to above 100 on the index,our rates are higher than Europeso even low FED funds draws money here.
WILD CARD, the TRILLION $$$$ Treasuries held by Asian countries......is
there a limit to how much they will buy?
What would make them sell?
MORE Likely yields fall, then selling causing yields to rise, IMHO.
I again bring attention to the MANY EXTREME readings and data we have right now, and my conclusion based on this is we will enter a VERY DIFFICULT period of ADJUSTMENTS........I am not a Shaman....WHEN it begins is not as important as understanding it WILL BEGIN.
Duratek
Does this look like inflation to you? There is NO foundation for a further rise in gold and silver based on this data IMHO.
Now certainly we have had asset inflation, but it is SEGREGATED, on a narrow defined area.
HAS higher OIL worked its way into the equation? What was different in the 70's when gold got near $900? No tech stocks to siphon off volume, BONDS offered screaming yields, we had a FED that reacted promptly to the inflation threat, we had TOO MUCH MONEY CHASING TOO FEW GOODS.....that is the essence of inflation gold is not going to see anytime soon.....NOT with CHINESE production seemingly limitless.
Not with 6 new dollars printed for each one that existed prior to the last 40 months, with historical easy money, with housing going thru the roof, higher oil prices etc, we don't even have a NEW HIGH for gold in 2005!
Now I'm not dissing gold, I am pointing out we have a BLACK HOLE that is sucking up all this liquidity without a marked pick up in inflation, in at least the way it is beiing presented, perhaps a whole other discussion on manipulated data! Hedonic BS seasonally adjusted hooga booga.
Surely in my business I keep getting 4% increase here, and there, but "back then" I would get 10% increases which is like 15% increases now or more.
A 50% retrace of the dollar loss from high bring us back to above 100 on the index,our rates are higher than Europeso even low FED funds draws money here.
WILD CARD, the TRILLION $$$$ Treasuries held by Asian countries......is
there a limit to how much they will buy?
What would make them sell?
MORE Likely yields fall, then selling causing yields to rise, IMHO.
I again bring attention to the MANY EXTREME readings and data we have right now, and my conclusion based on this is we will enter a VERY DIFFICULT period of ADJUSTMENTS........I am not a Shaman....WHEN it begins is not as important as understanding it WILL BEGIN.
Duratek
ANOTHER CONFIDENCE POLL
Confidence in US economy slips in July- report
Tue Jul 12, 2005 09:59 AM ET NEW YORK, July 12 (Reuters) - U.S. consumers' were less optimistic about the economy in July as gasoline prices edged higher, according to a survey released on Tuesday.
Investor's Business Daily and TechnoMetrica Market Intelligence said their economic optimism index slipped 1.9 points to 48.6 from June's 50.5. A reading above 50 indicates optimism while a reading below 50 indicates pessimism.
"The across-the-board decline is not surprising given that gasoline prices kept rising throughout the month of June," said Raghavan Mayur, president of TIPP, a unit of TechnoMetrica Market Intelligence, IBD's polling partner.
D
Tue Jul 12, 2005 09:59 AM ET NEW YORK, July 12 (Reuters) - U.S. consumers' were less optimistic about the economy in July as gasoline prices edged higher, according to a survey released on Tuesday.
Investor's Business Daily and TechnoMetrica Market Intelligence said their economic optimism index slipped 1.9 points to 48.6 from June's 50.5. A reading above 50 indicates optimism while a reading below 50 indicates pessimism.
"The across-the-board decline is not surprising given that gasoline prices kept rising throughout the month of June," said Raghavan Mayur, president of TIPP, a unit of TechnoMetrica Market Intelligence, IBD's polling partner.
D
Tuesday, July 12, 2005
HOME RUN?
Group predicts record home sales to continue thru 2007.
I guess the middle class being priced out, 70% already own, prices at assinine levels already....wages stagnant excetra excetra
D
I guess the middle class being priced out, 70% already own, prices at assinine levels already....wages stagnant excetra excetra
D
$455.58
That' s gold's 2005 high, also gold has come under its rising tredline formed from 2001 lows.
Knowing the FED has added record amounts of liquidity, and Bush's STIMULUS package, and we have witnessed a record easing with 45 lows in interest rates, and HERE we sit with gold NOT EVEN above its 2005 highs let alone its all time high??!! What gives?
NOT outright DEFLATION, but a deflationary trend is at work, SUCKING UP the liquidity, giving us a FLAT Y/Y money supply growth. And we are needing ever more increasing amounts to get the same bang for our tattered buck.
IMHO, we will see the yield on Bonds and Treasuries trade in a range to up until next job report where I believe will turn down hard with lessening effects of NET BIRTH MODEL, and the BEAR MKT will again begin to exert itself.
The rally now afoot means nothing to me, I am more concerned with larger trend and when it might resume.
D
Knowing the FED has added record amounts of liquidity, and Bush's STIMULUS package, and we have witnessed a record easing with 45 lows in interest rates, and HERE we sit with gold NOT EVEN above its 2005 highs let alone its all time high??!! What gives?
NOT outright DEFLATION, but a deflationary trend is at work, SUCKING UP the liquidity, giving us a FLAT Y/Y money supply growth. And we are needing ever more increasing amounts to get the same bang for our tattered buck.
IMHO, we will see the yield on Bonds and Treasuries trade in a range to up until next job report where I believe will turn down hard with lessening effects of NET BIRTH MODEL, and the BEAR MKT will again begin to exert itself.
The rally now afoot means nothing to me, I am more concerned with larger trend and when it might resume.
D
Monday, July 11, 2005
STRIKE 2
????INVERSION OF YIELD CURVE????
"Doh, wha is it? da concundrim" says Greenspam. "You couldn't see a bubble until you actually had one....." I wouldn't know a bubble if I Had both hands on it" Be afraid be very afraid.
No, of course there couldn't be a bad reason for flattening curve, first off most investors don;t care or pay attention.
IF the FED STOPS raising rates, then the bond market will SCREAM towards the funds rate, it doesn't matter WHAT the FED does at this point. IMHO
There is a Bradley turn date coming in 2 days, wanna bet it is going to a high?
D
"Doh, wha is it? da concundrim" says Greenspam. "You couldn't see a bubble until you actually had one....." I wouldn't know a bubble if I Had both hands on it" Be afraid be very afraid.
No, of course there couldn't be a bad reason for flattening curve, first off most investors don;t care or pay attention.
IF the FED STOPS raising rates, then the bond market will SCREAM towards the funds rate, it doesn't matter WHAT the FED does at this point. IMHO
There is a Bradley turn date coming in 2 days, wanna bet it is going to a high?
D
Stock options must be expensed
Stock options must be expensed
By Matt Krantz, USA TODAY (dec 2004)
Count one for the bean counters.
After years of heated debate between high-tech companies and accountants, the head accounting rule-setting body Thursday declared all companies must subtract the cost of stock options from their earnings starting in mid-2005.
It's a massive blow for companies, mainly in Silicon Valley, which had been doling out lucrative stock options to employees and executives for decades but not counting them as a cost. It also requires investors to rethink how they value companies: The new rule will affect everything from price-earnings ratios to earnings estimates.
Accountants, thinking companies had been enjoying a loophole that understated their costs, applauded the decision. The new rule will have "a big impact, but it's the right move," says Ed Nusbaum, CEO of accounting firm Grant Thornton.
The rule change, approved by the Financial Accounting Standards Board, represents a massive shift because it:
•Affects so many companies. Only 117 companies in the Standard & Poor's 500 index currently expense options, says David Zion, accounting analyst at Credit Suisse First Boston. That means a majority will need to start.
•Puts a big dent into reported earnings. Had all companies in the S&P 500 expensed the cost of options, reported earnings would have been 20% lower in 2001, 19% lower in 2002 and 8% lower last year, Zion says. He says the rule could dent 2005 earnings 3%.
•Has massive effects on individual companies. Not surprisingly, tech companies that have relied on stock options to retain employees stand to suffer a big hit to earnings.
Consider Internet site Yahoo. Had the company been required to expense stock options last year, it would have reported earnings of 5 cents a share, 86% less than the 37 cents a share profit it reported. That makes a giant change in Yahoo's P-E on 2003 earnings: 742 under the new rule, vs. 100 before.
•Affects earnings estimates. It's still unclear if Wall Street analysts will ignore the new charge, or include it in the earnings estimates that investors watch, says David Dropsey, analyst with First Call.
High-tech firms are not pleased. "We remain opposed to expensing and will continue to work with the Congress, the administration and the SEC to come to an accurate, auditable, transparent solution," says Cisco Systems' spokesman John Earnhardt.
Sen. Peter Fitzgerald, R.-Ill., one of the rule's champions, says he fears companies will wait for his retirement this year and try to derail the rule before it kicks in June 15.
Silicon Valley companies "will stop at nothing to stop this (rule) from going into effect," he says.
By Matt Krantz, USA TODAY (dec 2004)
Count one for the bean counters.
After years of heated debate between high-tech companies and accountants, the head accounting rule-setting body Thursday declared all companies must subtract the cost of stock options from their earnings starting in mid-2005.
It's a massive blow for companies, mainly in Silicon Valley, which had been doling out lucrative stock options to employees and executives for decades but not counting them as a cost. It also requires investors to rethink how they value companies: The new rule will affect everything from price-earnings ratios to earnings estimates.
Accountants, thinking companies had been enjoying a loophole that understated their costs, applauded the decision. The new rule will have "a big impact, but it's the right move," says Ed Nusbaum, CEO of accounting firm Grant Thornton.
The rule change, approved by the Financial Accounting Standards Board, represents a massive shift because it:
•Affects so many companies. Only 117 companies in the Standard & Poor's 500 index currently expense options, says David Zion, accounting analyst at Credit Suisse First Boston. That means a majority will need to start.
•Puts a big dent into reported earnings. Had all companies in the S&P 500 expensed the cost of options, reported earnings would have been 20% lower in 2001, 19% lower in 2002 and 8% lower last year, Zion says. He says the rule could dent 2005 earnings 3%.
•Has massive effects on individual companies. Not surprisingly, tech companies that have relied on stock options to retain employees stand to suffer a big hit to earnings.
Consider Internet site Yahoo. Had the company been required to expense stock options last year, it would have reported earnings of 5 cents a share, 86% less than the 37 cents a share profit it reported. That makes a giant change in Yahoo's P-E on 2003 earnings: 742 under the new rule, vs. 100 before.
•Affects earnings estimates. It's still unclear if Wall Street analysts will ignore the new charge, or include it in the earnings estimates that investors watch, says David Dropsey, analyst with First Call.
High-tech firms are not pleased. "We remain opposed to expensing and will continue to work with the Congress, the administration and the SEC to come to an accurate, auditable, transparent solution," says Cisco Systems' spokesman John Earnhardt.
Sen. Peter Fitzgerald, R.-Ill., one of the rule's champions, says he fears companies will wait for his retirement this year and try to derail the rule before it kicks in June 15.
Silicon Valley companies "will stop at nothing to stop this (rule) from going into effect," he says.
NDX
AT UPPER BB, now what? RSI nearing overbought.
Weekly less sure, weekly RSI not yet oversold, there is room there, but MACD has been flagging weakly, leveling off not rising but not falling below zero yet ( a sell signal) .
1569 looking important.
D
Weekly less sure, weekly RSI not yet oversold, there is room there, but MACD has been flagging weakly, leveling off not rising but not falling below zero yet ( a sell signal) .
1569 looking important.
D
MARKET COMMENTS MONDAY JULY 11TH
Though the market rally continues, the volume suggests less than a stamp of approval pace and less than full participation. Institutions may not be along for the ride.
Into month 7 in 2005 and and we have a very mixed market performance with flat as good to down for tech.
The rally on "bad news" is something to watch out for (London terrorist act) but I feel the SPX manipulations prior to open take some OOMPH out of it.
We are in nothing more than a trading range environment.
The rallies come on weakish volume, but new highs are perking up, but are these bond funds and energy stocks mostly? REG $2.31/gal in B'more
Aren't ENERGY STOCKS skewing SPX 500 earnings data? I fell the earnings coming from the SPX sectors are not balanced, do not present a fair and correct economic picture.
Haven't we seen the TOP in earnings momentum? WHAT will drive it in the near future?
Housing prices have rose in a PARABOLIC fashion, now making it tough even on the middle class to afford a home, granted with low rates. If a rise in tax property asessments puts a hurting on home owners, that is a source of worry given punkerish wage growth.....and a rise in cost of the things we need, deflatoin in much else.
LOW LOW Treasury yields are a function IMHO of a weak economic environment, LAST time yields flattened like this we had an economic crash ( just prior to OCT 1987) SOMETHING is wrong, others delight in such a setup, and find it bullish.
SO, markets seem pretty bullish and fun to be long, and even terorist action is nothing to worry about, as a CONTRARIAN, this lack of fear and total complacency I find BEARISH (surprised? LOL)
In IRAQ, support is growing for US TROOPS to leave, and fight the war on terror somwhere else. WILL we abide by the will of the new Gov. like it or not?
Isn't the reason so many are dying and terrorists are being drawn to Iraq ONLY because we are there?
10 YR DOW SEE how MACD AND RSI have been falling since 2004? showing weak momentum? DOW gone nowhere since 1998. I see 2 things, potential multi year reverse Head and SHoulders a break of 2005 highs could lead to charge at all time highs. OR 10,940 is the HEAD and we are putting in right shoulder here! NOT much support BELOW 10K (is why the PPT protect it so!)
SPX/VIX RATIO hits new highs ands hows NO sign of weakening yet. But also take note of awesome triple top here. SHOULD PUT CAP ON RALLY.
VXO (old VIX formula) Hitting LOWS NOT seen since 1995 or before? That was during 20 year bull mkt, yet we make these kinds of moves, and we are WAY below the highs made??!!!
As it the many EXTREMES we are hitting in this "echo bull" which we have now MULTIPLE BUBBLES instead of just one (NAZ) we have CREDIT, HOUSING, BONDS, and DEBT bubbles.
Opinion or fact. I am as cautious as ever, standing my ground, it's a traders market, that's all.
Tune into CNBC for the blather or that ass's show loudmouth obnoxious Cramer, how weak is that?
SHould WE be allowed to HYPE the stocks we own? on TV? woof
Duratek
Into month 7 in 2005 and and we have a very mixed market performance with flat as good to down for tech.
The rally on "bad news" is something to watch out for (London terrorist act) but I feel the SPX manipulations prior to open take some OOMPH out of it.
We are in nothing more than a trading range environment.
The rallies come on weakish volume, but new highs are perking up, but are these bond funds and energy stocks mostly? REG $2.31/gal in B'more
Aren't ENERGY STOCKS skewing SPX 500 earnings data? I fell the earnings coming from the SPX sectors are not balanced, do not present a fair and correct economic picture.
Haven't we seen the TOP in earnings momentum? WHAT will drive it in the near future?
Housing prices have rose in a PARABOLIC fashion, now making it tough even on the middle class to afford a home, granted with low rates. If a rise in tax property asessments puts a hurting on home owners, that is a source of worry given punkerish wage growth.....and a rise in cost of the things we need, deflatoin in much else.
LOW LOW Treasury yields are a function IMHO of a weak economic environment, LAST time yields flattened like this we had an economic crash ( just prior to OCT 1987) SOMETHING is wrong, others delight in such a setup, and find it bullish.
SO, markets seem pretty bullish and fun to be long, and even terorist action is nothing to worry about, as a CONTRARIAN, this lack of fear and total complacency I find BEARISH (surprised? LOL)
In IRAQ, support is growing for US TROOPS to leave, and fight the war on terror somwhere else. WILL we abide by the will of the new Gov. like it or not?
Isn't the reason so many are dying and terrorists are being drawn to Iraq ONLY because we are there?
10 YR DOW SEE how MACD AND RSI have been falling since 2004? showing weak momentum? DOW gone nowhere since 1998. I see 2 things, potential multi year reverse Head and SHoulders a break of 2005 highs could lead to charge at all time highs. OR 10,940 is the HEAD and we are putting in right shoulder here! NOT much support BELOW 10K (is why the PPT protect it so!)
SPX/VIX RATIO hits new highs ands hows NO sign of weakening yet. But also take note of awesome triple top here. SHOULD PUT CAP ON RALLY.
VXO (old VIX formula) Hitting LOWS NOT seen since 1995 or before? That was during 20 year bull mkt, yet we make these kinds of moves, and we are WAY below the highs made??!!!
As it the many EXTREMES we are hitting in this "echo bull" which we have now MULTIPLE BUBBLES instead of just one (NAZ) we have CREDIT, HOUSING, BONDS, and DEBT bubbles.
Opinion or fact. I am as cautious as ever, standing my ground, it's a traders market, that's all.
Tune into CNBC for the blather or that ass's show loudmouth obnoxious Cramer, how weak is that?
SHould WE be allowed to HYPE the stocks we own? on TV? woof
Duratek
STRIKE ONE
HOUSING RICING OUT BUYERS? Say it ain't so!
And it IS the ENGINE of the economy. Home buying begets financial lenders profits, trips to Home Depot, use of raw materials, buying of furniture, dishes , plastic bags, lawn mowers, home improvement, yada yada.....
D
And it IS the ENGINE of the economy. Home buying begets financial lenders profits, trips to Home Depot, use of raw materials, buying of furniture, dishes , plastic bags, lawn mowers, home improvement, yada yada.....
D
Saturday, July 09, 2005
WEEKEND COMMENTS "everyone out of the pool"
I once held a stock out of "loyalty" and a promise maybe I shouldn't have made, and it cost me.....so rah rah man I will not be for a given thing, so my mind is clear to do what needs to be done....make no doubt, GOLD WILL SHINE, but IMHO first it must exhibit DEFLATIONARY warnings, as SILVER IS/WILL do.........and should that much anticipated EXHAUSTION Bull leg begin for gold, it is its nature to begin with weak hands shook off....this will occur when gold falls below $400 IMHO...it will seperate those from what they thought they loved most, and have them slapping themselves for having done so sometime later on.....just look at the chart of NEM with an open mind and tell me what you see.....being the center of the gold universe.
http://www.safehaven.com/showarticle.cfm?id=3382 A MUST READ for those open to thinking Kondratieff "LONG" Waves as possible.
Comments about BONDS VS STOCKS a very valid point IMHO.
We are VERY EARLY in the Winter games.
I saw a tick chart of the SPX'S from Thursday, as 3:30 or thereabouts the SPX's were forcasting, as I said, about a 200 POINT drubbing was coming. THAT was the LOW point, it went vertical from then on to close !!!
WHO could have come in at that time, what trader or group of like thinking traders?....would be starting when we were sleeping and turned the direction of markets around at this time?
WHO thought a terrorist ATTACK, a deadly one, on sovereign soil, of a free nation, our closest ally was a good sign to buy like there was NO tomorrow? not to want stocks but was famished so? CRAVED THEM, HAD TO HAVE THEM?
IMHO FWIW.......a decided effort avoided a stock market crash, what good is coming from a showing of our suceptability, our vulneralbility? of terrorism coming to our shores again?
YOU KNOW the answer.
According to EWT, the market MUST close down shortly after open on Monday, or the rally most likely has legs, but doesn't change a thing.
I am thinking, Bond yields may rise one last time, given second chance (or more)for safe entry before NEXT employment report almost guaranteed to stink and miss estimates.....IMHO the strongest manipulation thru net birth death is over and we are going to see some very weak employment reports maybe thru end of year....this will put pressure on yields and keep bond rally going, I want treasuries if I can time them right.
IMHO, rally is gift horse in mouth, to be sold, and portfolio adjusted accordingly with LESS RISK and RAISE CASH,
TECH will slide first, impacted by real slowdown in economy and direction of stock options being expensed.
Think of the long cycles, think of what extremes exist in historical data and trends, think of how or what economy in history expanded and prospered when there were NO SAVINGS to invest....was loaded with historical extremes in all kinds of DEBT, where ASSET inflation was only wealth......
EVEN the effect of rising property taxes now begun to be felt, is putting a hurt on new home buyers and old.
WHERE condo's are bought because nothing else can be afforded.
WHere an economy and market are held up by the invisable hand.....these situations do not last forever.
It is not predicting their exact timing or end that is important, it is understanding that they do exist and act accordingly to prepare for leaner times.
PRINTING money after all, is only a fools game and never leads to sustainable enhancement.
http://www.safehaven.com/showarticle.cfm?id=3382 A MUST READ for those open to thinking Kondratieff "LONG" Waves as possible.
Comments about BONDS VS STOCKS a very valid point IMHO.
We are VERY EARLY in the Winter games.
I saw a tick chart of the SPX'S from Thursday, as 3:30 or thereabouts the SPX's were forcasting, as I said, about a 200 POINT drubbing was coming. THAT was the LOW point, it went vertical from then on to close !!!
WHO could have come in at that time, what trader or group of like thinking traders?....would be starting when we were sleeping and turned the direction of markets around at this time?
WHO thought a terrorist ATTACK, a deadly one, on sovereign soil, of a free nation, our closest ally was a good sign to buy like there was NO tomorrow? not to want stocks but was famished so? CRAVED THEM, HAD TO HAVE THEM?
IMHO FWIW.......a decided effort avoided a stock market crash, what good is coming from a showing of our suceptability, our vulneralbility? of terrorism coming to our shores again?
YOU KNOW the answer.
According to EWT, the market MUST close down shortly after open on Monday, or the rally most likely has legs, but doesn't change a thing.
I am thinking, Bond yields may rise one last time, given second chance (or more)for safe entry before NEXT employment report almost guaranteed to stink and miss estimates.....IMHO the strongest manipulation thru net birth death is over and we are going to see some very weak employment reports maybe thru end of year....this will put pressure on yields and keep bond rally going, I want treasuries if I can time them right.
IMHO, rally is gift horse in mouth, to be sold, and portfolio adjusted accordingly with LESS RISK and RAISE CASH,
TECH will slide first, impacted by real slowdown in economy and direction of stock options being expensed.
Think of the long cycles, think of what extremes exist in historical data and trends, think of how or what economy in history expanded and prospered when there were NO SAVINGS to invest....was loaded with historical extremes in all kinds of DEBT, where ASSET inflation was only wealth......
EVEN the effect of rising property taxes now begun to be felt, is putting a hurt on new home buyers and old.
WHERE condo's are bought because nothing else can be afforded.
WHere an economy and market are held up by the invisable hand.....these situations do not last forever.
It is not predicting their exact timing or end that is important, it is understanding that they do exist and act accordingly to prepare for leaner times.
PRINTING money after all, is only a fools game and never leads to sustainable enhancement.
Duratek
Friday, July 08, 2005

SPX VIX RATIO
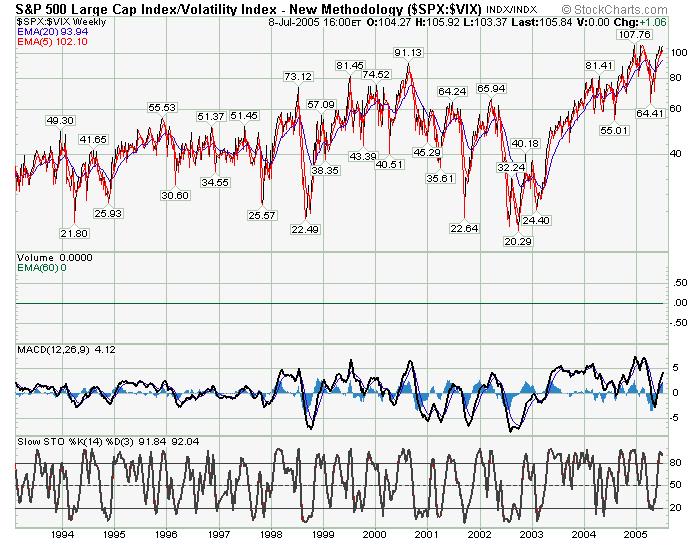 The SPX/VIX Ratio is back to 105.84, you can see the triple top which appears to have taken shape.
And also observe where this ratio was in 1999-2000. IMHO I think it has significance, and would be surprised if this ratio made a new leap to another level.
Certainly it should be near its top and not ready for another impulsive move up. Stockcharts.com provided chart.
Duratek
BEARS CRYING UNCLE
from YHOO finance:
3:59PM Afternoon Wrap:
Impressive extension of reversal :Although the market took a dive early on Thursday it quickly stabilized with the action from midday yesterday all through today a near vertical climb. The surge has come amid broad based participation with little other than energy (Oil Service -0.9%, Oil -0.3%, Natural Gas -0.2%) on the defensive today. Top performing groups include: Airline +3.8%, Biotech +2.8%, Networking +2.52, Computer-Hardware -2.4%, Semi +2.4%, Steel +2.3%, Casino +2.1%, Chemical +2%, Transportation +1.9%, Broker/Dealer +1.5%, Paper +1.4%, Internet +1.4%, REITs +1.4%.
3:52PM New 52-Week Highs: REITs and Retailers :Nearly every major REIT is at a new 52-week high today, along with a bunch of retailers. Tallies so far today for new highs vs lows are 394-16 (NYSE) and 175-19 (Nasdaq)... Sectors with good representation on the new high list today include Recent IPOs (CTRN, KNXA, WTI, VLCM, ZUMZ), Retail (BBY, BKS, CHRS, CTRN, COH, CVS, DKS, DBRN, GAP, GES, GME, JCP, KSS, STGS, VLCM), REITs (ACC, AKR, ARE, BRE, BXP, CLI, DDR, EOP, EQR, ESS, FMP, FRT, GGP, HCN, KIM, KPA, KRC, MAA, MAC, PEI, PNP, PSA, SKT, SLG, SPG, SSS, VNO).
3:31PM With market surging and talk that hedge funds are out jamming shorts, may want to look at this month's Heavily Shorted Stocks Report :Names of interest this month include Jamdat Mobile (JMDT), Dollar Financial (DLLR) and Deckers (DECK). See the Small Cap Focus page for the report.
*It would appear, with strength and breadth of advance, the bulls are not yet done. 412 new highs on NYSE.
OPEX next Friday, I don't know if today was in advance of that. gain, with turn around engineered or not in place, it's open season and the bears are on the run.
I will be out of town until Sunday, so this will be my last post until next week. It should be interesting read from Elliot Wave Theory tonight. I would ASSUME the wave count has changed and we obviously are not witnessing a 3rd of a 3rd. of which they seemed so sure of.
SPX/VIX ratio vaulted back 10 points today to close near its high reading. I suggest Monday could open with some follow through, but we could see some weakness near end of week, it may depend on more than earnings but guidance going into next quarter.
I do not feel stocks have the kind of earnings momentum going forward to warrant playing them, holding them. As quickly as a rally comes from nowhere so does the declines.
But I have no crystal ball, and the wind is at the back of the rally, it may have some legs left.
Weekly NDX technicals have been positive, but the bars have not been doing much since going positive.
I would use tight stops if deciding to play anything long.
BDI continues its decline, a rather odd development given the bullishness for the world's economies, I cannot disregard that.
EVEN with the HOOPLAH, we are below water here in the year ending in 5 2005.
Is this the start of the famed SUMMER RALLY going into August? I am not sure, but you can never outguess the market.
It is NOT easy sitting it out, maybe settling for small gains with MM or treasuries, yield funds. BUt a strategy of buying stocks only because they are going up is a losing strategy.
Can you find value? dividend yield? stocks selling for 1 or 2 X book value. 3 or 4 sales?
I can survive without additional income, I still believe we are in a secular bear market held at bay, and definately NOT the beginning of another long running secular bull mkt.....for reasons ad nauseum I have listed.
I trust the 100 year plus history of the market, and my reasoning based on that. Today was fun if you were long, maybe more coming, as long as you know when enough is enough, most will not see a problem until long after it is too late to get out.
Until the next time,
Duratek
3:59PM Afternoon Wrap:
Impressive extension of reversal :Although the market took a dive early on Thursday it quickly stabilized with the action from midday yesterday all through today a near vertical climb. The surge has come amid broad based participation with little other than energy (Oil Service -0.9%, Oil -0.3%, Natural Gas -0.2%) on the defensive today. Top performing groups include: Airline +3.8%, Biotech +2.8%, Networking +2.52, Computer-Hardware -2.4%, Semi +2.4%, Steel +2.3%, Casino +2.1%, Chemical +2%, Transportation +1.9%, Broker/Dealer +1.5%, Paper +1.4%, Internet +1.4%, REITs +1.4%.
3:52PM New 52-Week Highs: REITs and Retailers :Nearly every major REIT is at a new 52-week high today, along with a bunch of retailers. Tallies so far today for new highs vs lows are 394-16 (NYSE) and 175-19 (Nasdaq)... Sectors with good representation on the new high list today include Recent IPOs (CTRN, KNXA, WTI, VLCM, ZUMZ), Retail (BBY, BKS, CHRS, CTRN, COH, CVS, DKS, DBRN, GAP, GES, GME, JCP, KSS, STGS, VLCM), REITs (ACC, AKR, ARE, BRE, BXP, CLI, DDR, EOP, EQR, ESS, FMP, FRT, GGP, HCN, KIM, KPA, KRC, MAA, MAC, PEI, PNP, PSA, SKT, SLG, SPG, SSS, VNO).
3:31PM With market surging and talk that hedge funds are out jamming shorts, may want to look at this month's Heavily Shorted Stocks Report :Names of interest this month include Jamdat Mobile (JMDT), Dollar Financial (DLLR) and Deckers (DECK). See the Small Cap Focus page for the report.
*It would appear, with strength and breadth of advance, the bulls are not yet done. 412 new highs on NYSE.
OPEX next Friday, I don't know if today was in advance of that. gain, with turn around engineered or not in place, it's open season and the bears are on the run.
I will be out of town until Sunday, so this will be my last post until next week. It should be interesting read from Elliot Wave Theory tonight. I would ASSUME the wave count has changed and we obviously are not witnessing a 3rd of a 3rd. of which they seemed so sure of.
SPX/VIX ratio vaulted back 10 points today to close near its high reading. I suggest Monday could open with some follow through, but we could see some weakness near end of week, it may depend on more than earnings but guidance going into next quarter.
I do not feel stocks have the kind of earnings momentum going forward to warrant playing them, holding them. As quickly as a rally comes from nowhere so does the declines.
But I have no crystal ball, and the wind is at the back of the rally, it may have some legs left.
Weekly NDX technicals have been positive, but the bars have not been doing much since going positive.
I would use tight stops if deciding to play anything long.
BDI continues its decline, a rather odd development given the bullishness for the world's economies, I cannot disregard that.
EVEN with the HOOPLAH, we are below water here in the year ending in 5 2005.
Is this the start of the famed SUMMER RALLY going into August? I am not sure, but you can never outguess the market.
It is NOT easy sitting it out, maybe settling for small gains with MM or treasuries, yield funds. BUt a strategy of buying stocks only because they are going up is a losing strategy.
Can you find value? dividend yield? stocks selling for 1 or 2 X book value. 3 or 4 sales?
I can survive without additional income, I still believe we are in a secular bear market held at bay, and definately NOT the beginning of another long running secular bull mkt.....for reasons ad nauseum I have listed.
I trust the 100 year plus history of the market, and my reasoning based on that. Today was fun if you were long, maybe more coming, as long as you know when enough is enough, most will not see a problem until long after it is too late to get out.
Until the next time,
Duratek
No BEARS LEFT IN THE DEN
Sign says, "do not feed the bears"
Fools went in Wed night and bought the sold the futures based on London act of terrorism would cause a panic.
Was NEG 22 SPX NEG 36 NDX but Thursday action improved before open (invisible hand?) and market closed UP. Shorts (newbie) again BURNED sszzzztttttt. THOSE goofs will not be around when the market finally succumbs.
Emboldened by the miraculous recovery, of course let's party today what a relief, no big deal 50 dies etc, the market held up! An emotional response that isn't backed by very much.
This could be the final bullish surge, drawing back in the last holdouts, the bears are playing this bounce long......and I wonder about the distribution days.
That's cool, why should an act such as that determine the value of a company?
But I don't think investors care or are aware of the valuations they invest in. Business as usual.
D
Fools went in Wed night and bought the sold the futures based on London act of terrorism would cause a panic.
Was NEG 22 SPX NEG 36 NDX but Thursday action improved before open (invisible hand?) and market closed UP. Shorts (newbie) again BURNED sszzzztttttt. THOSE goofs will not be around when the market finally succumbs.
Emboldened by the miraculous recovery, of course let's party today what a relief, no big deal 50 dies etc, the market held up! An emotional response that isn't backed by very much.
This could be the final bullish surge, drawing back in the last holdouts, the bears are playing this bounce long......and I wonder about the distribution days.
That's cool, why should an act such as that determine the value of a company?
But I don't think investors care or are aware of the valuations they invest in. Business as usual.
D
Checking my condition my condition is in
Stocks Surge on Job Creation ReportFri 12:21PM ET - APA mixed job creation report carried enough good news to push stocks sharply higher Friday, even as crude oil futures climbed back above $61 per barrel. The Dow Jones industrials rose 110 points.
*No wage growth. Hours worked unchanged. Drop in unemployment rate? (as more gave up) MISS on jobs created, weaker than expected. (NET BIRTH DEATH ADDED 184,000 !!!)
SO as YHOO or CNN would tell us, an economy 3 years into "recovery" is having trouble creating jobs (need 150K per month JUST to keep up with new entries) so they have to create jobs out of thin air and manipulate the data to say what they want it to say, figuring when they have to reconcile it, nobody will be watching.
70% of Americans NOW own their home (or owe on a home I should say?) and I ask, how many are left to buy? don't say 30% !! LOL
ZERO savings rate can continue indefinately.Historical levels of credit an debt and go on forever, wealth by ASSET INFLATION is just as good as the old fashioned way.
Then I guess if you agree, stay in the market and good luck.
Duratek
*No wage growth. Hours worked unchanged. Drop in unemployment rate? (as more gave up) MISS on jobs created, weaker than expected. (NET BIRTH DEATH ADDED 184,000 !!!)
SO as YHOO or CNN would tell us, an economy 3 years into "recovery" is having trouble creating jobs (need 150K per month JUST to keep up with new entries) so they have to create jobs out of thin air and manipulate the data to say what they want it to say, figuring when they have to reconcile it, nobody will be watching.
70% of Americans NOW own their home (or owe on a home I should say?) and I ask, how many are left to buy? don't say 30% !! LOL
ZERO savings rate can continue indefinately.Historical levels of credit an debt and go on forever, wealth by ASSET INFLATION is just as good as the old fashioned way.
Then I guess if you agree, stay in the market and good luck.
Duratek
Thursday, July 07, 2005
"OUR WEALTH LOOKS GREAT ON PAPER"
Bull market ended between 1999 and mid 2000. We have had a correction that began in 2000 and ended late 2002 (OCT) 2003 (MArch) a 3 yr long Bear MArket, SECULAR in nature...so ended phase ONE.
To correct the dispair and VIX spikes of the Bear, PHASE ONE gets interupted by a CYCLICAL Bull Market, of which most bears didnt see coming....IMHO by its time and action is LONG in the tooth.
20 years PLUS long by some accords (1974 vs 1982 beginning) last bull was a RECORD in many ways.....TOP PE ratio etc.
Phase 2 of the bear mkt I think has begun, and this beleive it or not will be the painful part...yet NOT the end, that will be Phase 3.
Several reasons lead me to believe this.
Historic norms for the last 3 bear market bottoms.
Lack of 90% down days.
RECORD bullishness of bulls plurality over 140 weeks straight, only 9 weeks of bears on top even during worst bear in decades. I mentioned last bear had 40 plus weeks of bears on top 50% plus.
And what has replaced last economic driver of which was paper profits? MORE paper profits? and DIRT profits....MORE of the SAME asset inflation!! NOT INVESTMENT FROM SAVINGS.
How could THIS, consumer driven economy be sustainable?
DEBT LEVELS NEVER before seen.
SPX/VIX ratio's never before seen.
Bullishness never before seen.
Money growth never before seen.
$9 trillion derivitive market no one understands.
Greatest investor of all time? Buffet SOROS....making one of the worst bets of all time on dollar weakness at LOWS out $100's of mil probably close to $500 million.
5 years straight of record housing market and price appreciation.
Weakest recovery in history in relation to jobs and wage growth....even though we had record stimulus and tax cuts and lowest rates in 45 years held there for over 12 months.
Baltic Dry Index (RR stubbornly never mentions) crashing below BULL SUPPORT LINES.
NO YIELD WITHOUT RISK for saver wannabe's.
Losing our manufacturing base without anything tangable except military might to take its place as yet.
We are the rishest nation, yet we are SO POOR!
WHat do I worry about? HOW the historic bear market bottom valuations and measure get met.
Our wealth looks GREAT on paper, that's what worries me........ cycles dominant nature, winter is coming, I hope it is short. GET DEFENSIVE and IN CASH IMHO and maybe we can catch golds bottom under $400 IMHO
To correct the dispair and VIX spikes of the Bear, PHASE ONE gets interupted by a CYCLICAL Bull Market, of which most bears didnt see coming....IMHO by its time and action is LONG in the tooth.
20 years PLUS long by some accords (1974 vs 1982 beginning) last bull was a RECORD in many ways.....TOP PE ratio etc.
Phase 2 of the bear mkt I think has begun, and this beleive it or not will be the painful part...yet NOT the end, that will be Phase 3.
Several reasons lead me to believe this.
Historic norms for the last 3 bear market bottoms.
Lack of 90% down days.
RECORD bullishness of bulls plurality over 140 weeks straight, only 9 weeks of bears on top even during worst bear in decades. I mentioned last bear had 40 plus weeks of bears on top 50% plus.
And what has replaced last economic driver of which was paper profits? MORE paper profits? and DIRT profits....MORE of the SAME asset inflation!! NOT INVESTMENT FROM SAVINGS.
How could THIS, consumer driven economy be sustainable?
DEBT LEVELS NEVER before seen.
SPX/VIX ratio's never before seen.
Bullishness never before seen.
Money growth never before seen.
$9 trillion derivitive market no one understands.
Greatest investor of all time? Buffet SOROS....making one of the worst bets of all time on dollar weakness at LOWS out $100's of mil probably close to $500 million.
5 years straight of record housing market and price appreciation.
Weakest recovery in history in relation to jobs and wage growth....even though we had record stimulus and tax cuts and lowest rates in 45 years held there for over 12 months.
Baltic Dry Index (RR stubbornly never mentions) crashing below BULL SUPPORT LINES.
NO YIELD WITHOUT RISK for saver wannabe's.
Losing our manufacturing base without anything tangable except military might to take its place as yet.
We are the rishest nation, yet we are SO POOR!
WHat do I worry about? HOW the historic bear market bottom valuations and measure get met.
Our wealth looks GREAT on paper, that's what worries me........ cycles dominant nature, winter is coming, I hope it is short. GET DEFENSIVE and IN CASH IMHO and maybe we can catch golds bottom under $400 IMHO
Duratek
My latest TIRADE "It's different now"
Bull market ended between 1999 and mid 2000. We have had a correction that began in 2000 and ended late 2002 (OCT) 2003 (MArch) a 3 yr long Bear MArket, SECULAR in nature...so ended phase ONE.
To correct the dispair and VIX spikes of the Bear, PHASE ONE gets interupted by a CYCLICAL Bull Market, of which most bears didnt see coming....IMHO by its time and action is LONG in the tooth.
20 years PLUS long by some accords (1974 vs 1982 beginning) last bull was a RECORD in many ways.....TOP PE ratio etc.
Phase 2 of the bear mkt I think has begun, and this beleive it or not will be the painful part...yet NOT the end, that will be Phase 3.
Several reasons lead me to believe this.
Historic norms for the last 3 bear market bottoms.
Lack of 90% down days.
RECORD bullishness of bulls plurality over 140 weeks straight, only 9 weeks of bears on top even during worst bear in decades. I mentioned last bear had 40 plus weeks of bears on top 50% plus.
And what has replaced last economic driver of which was paper profits? MORE paper profits? and DIRT profits....MORE of the SAME asset inflation!! NOT INVESTMENT FROM SAVINGS.
How could THIS, consumer driven economy be sustainable?
DEBT LEVELS NEVER before seen.
SPX/VIX ratio's never before seen.
Bullishness never before seen.
Money growth never before seen.
$9 trillion derivitive market no one understands.
Greatest investor of all time? Buffet SOROS....making one of the worst bets of all time on dollar weakness at LOWS out $100's of mil probably close to $500 million.
5 years straight of record housing market and price appreciation.
Weakest recovery in history in relation to jobs and wage growth....even though we had record stimulus and tax cuts and lowest rates in 45 years held there for over 12 months.
Baltic Dry Index (RR stubbornly never mentions) crashing below BULL SUPPORT LINES.
NO YIELD WITHOUT RISK for saver wannabe's.
Losing our manufacturing base without anything tangable except military might to take its place as yet.
We are the rishest nation, yet we are SO POOR!
WHat do I worry about? HOW the historic bear market bottom valuations and measure get met.
Our wealth looks GREAT on paper, that's what worries me........ CYCLES
Duratek
To correct the dispair and VIX spikes of the Bear, PHASE ONE gets interupted by a CYCLICAL Bull Market, of which most bears didnt see coming....IMHO by its time and action is LONG in the tooth.
20 years PLUS long by some accords (1974 vs 1982 beginning) last bull was a RECORD in many ways.....TOP PE ratio etc.
Phase 2 of the bear mkt I think has begun, and this beleive it or not will be the painful part...yet NOT the end, that will be Phase 3.
Several reasons lead me to believe this.
Historic norms for the last 3 bear market bottoms.
Lack of 90% down days.
RECORD bullishness of bulls plurality over 140 weeks straight, only 9 weeks of bears on top even during worst bear in decades. I mentioned last bear had 40 plus weeks of bears on top 50% plus.
And what has replaced last economic driver of which was paper profits? MORE paper profits? and DIRT profits....MORE of the SAME asset inflation!! NOT INVESTMENT FROM SAVINGS.
How could THIS, consumer driven economy be sustainable?
DEBT LEVELS NEVER before seen.
SPX/VIX ratio's never before seen.
Bullishness never before seen.
Money growth never before seen.
$9 trillion derivitive market no one understands.
Greatest investor of all time? Buffet SOROS....making one of the worst bets of all time on dollar weakness at LOWS out $100's of mil probably close to $500 million.
5 years straight of record housing market and price appreciation.
Weakest recovery in history in relation to jobs and wage growth....even though we had record stimulus and tax cuts and lowest rates in 45 years held there for over 12 months.
Baltic Dry Index (RR stubbornly never mentions) crashing below BULL SUPPORT LINES.
NO YIELD WITHOUT RISK for saver wannabe's.
Losing our manufacturing base without anything tangable except military might to take its place as yet.
We are the rishest nation, yet we are SO POOR!
WHat do I worry about? HOW the historic bear market bottom valuations and measure get met.
Our wealth looks GREAT on paper, that's what worries me........ CYCLES
Duratek
What I said
"Let's not jump to any conclusions just yet, let's watch the action and volume, with Richard Russell's PTI still in bullish reading, anything is posisble."
Tomorrow will be pivotal in forth coming action IMHO, doom averted today, will there be follow thru, as suggested it's all about the hedgies as it has been
D
Tomorrow will be pivotal in forth coming action IMHO, doom averted today, will there be follow thru, as suggested it's all about the hedgies as it has been
D
BEARS on the RUN?
Fact is, and you could see from early CPC and VIX readings, a fade in fear, actually no fear was present.Having been thru 911, and seeing traders a run the market, little guy did nothing then did even less now...they're holding been told to been trained to been hypnotized to.....and it didn't happen here....so why worry and it did happen THERE, so maybe better put money over here.....
Americans are the buyer/consumer chotskie lover of last resort, and its obvious the tank ain't empty, niether is easy credit harder.Such a one sided affair, but we are not a bunch of squirels, no need to stash some nuts away for leaner times.
ALL, today's non reaction and all else is the SIGN OF THE TIMES, the new attitude of what me worry. I mentioned that todays events though horrible was a one time act, and that the underlying situation is what will bear down....the reaction lasted a lot less than I figured.......but
But remember the little guy wasn't calling his broker to sell at the open, we are watching the hedgies and traders black boxes duke it out.
And if shorts have been anhilated as some suggest, pity the market that doesn't have an ample supply of shorts to help buy on the way down.
Did today mark some kind of low? QUite honestly I don't know, I stil see us trapped in a narrow zone.
Some think little birdie knows employment report tomorrow will be NICE, then that birdie must know how NET BIRTH DEATH ADDITIONS will effect the number.Also if bonds are so unattractive compared to stocks, WHY do the yields keep falling?Be looking (I will) for money supply figures FRI, the 2005 highs still not broken in the zig zag pattern.
I hope I nor did I see today's act as a LIGHT BULB ding ding ding buying alert.....some did...somebody's did....and it began in FUTURES PIT before open...very reassuring a huge decline can be averted with a little help very reassuring.
As is this BLOG or any post I write....all an exercise......
But the excercise for me has always been to DEVELOP my OWN OPINION and share it, own it....and it really doesn't matter to me if I am wrong....I got here honestly.
10k WILL BE GUARDED LIKE Fort Knox, like a pair of Marilyn Monroe briefs......like an original Artie Shaw Record (huh?).....when it goes with authority, and the I's the have's know this....the illusion goes...........but all time highs for DOW seem just as illusive.
Today changes nothing as did the reaction change nothing as to what is real and where we are headed.
Americans are the buyer/consumer chotskie lover of last resort, and its obvious the tank ain't empty, niether is easy credit harder.Such a one sided affair, but we are not a bunch of squirels, no need to stash some nuts away for leaner times.
ALL, today's non reaction and all else is the SIGN OF THE TIMES, the new attitude of what me worry. I mentioned that todays events though horrible was a one time act, and that the underlying situation is what will bear down....the reaction lasted a lot less than I figured.......but
But remember the little guy wasn't calling his broker to sell at the open, we are watching the hedgies and traders black boxes duke it out.
And if shorts have been anhilated as some suggest, pity the market that doesn't have an ample supply of shorts to help buy on the way down.
Did today mark some kind of low? QUite honestly I don't know, I stil see us trapped in a narrow zone.
Some think little birdie knows employment report tomorrow will be NICE, then that birdie must know how NET BIRTH DEATH ADDITIONS will effect the number.Also if bonds are so unattractive compared to stocks, WHY do the yields keep falling?Be looking (I will) for money supply figures FRI, the 2005 highs still not broken in the zig zag pattern.
I hope I nor did I see today's act as a LIGHT BULB ding ding ding buying alert.....some did...somebody's did....and it began in FUTURES PIT before open...very reassuring a huge decline can be averted with a little help very reassuring.
As is this BLOG or any post I write....all an exercise......
But the excercise for me has always been to DEVELOP my OWN OPINION and share it, own it....and it really doesn't matter to me if I am wrong....I got here honestly.
10k WILL BE GUARDED LIKE Fort Knox, like a pair of Marilyn Monroe briefs......like an original Artie Shaw Record (huh?).....when it goes with authority, and the I's the have's know this....the illusion goes...........but all time highs for DOW seem just as illusive.
Today changes nothing as did the reaction change nothing as to what is real and where we are headed.
Duratek
SPECIAL MARKET UPDATE
DEAR READERS,
My best wishes go out to our friends in England as our hearts are heavy with your losses.
Market reaction is of course not bullish in reaction to today's events, but it hasn't been an all out panic neither. I do not expect this horrific terrorist act to change the complexion of the world economies.
Could it hasten the coming correction we have been discussing? well of course it could, but understand it was ALREADY in motion as others will say it was oil or it was this tragic act of violence.
Volume so far is not blowout, more sedate than one would imagine, those bullish will not change their minds over this, but figure it a buying opportunity.
Those of us concerned with dividend yields and valuations have either been severely picky about longs or on sidelines in cash of treasuries and maybe some gold.
Puts out numbering calls and VIX rising, but FAR from signaling any kind of emotional crescendo.
EWT thinks a 3rd of a 3rd wave has begun with STRONG declines possible during its duration.
It is IMHO, VERY LIKELY the TOP is already in this cyclical bull market, Bob Brinker and others disagree. I respect those dissenting opinions.....but I also know what other bear bottoms looked like. lest us not forget that.
Let's not jump to any conclusions just yet, let's watch the action and volume, with Richard Russell's PTI still in bullish reading, anything is posisble.
I see where yields have risen back above 4% recovering some half of thier gains, and I wonder if for the short term we have seen the lows in yields....this yet to be determined.
Duratek
My best wishes go out to our friends in England as our hearts are heavy with your losses.
Market reaction is of course not bullish in reaction to today's events, but it hasn't been an all out panic neither. I do not expect this horrific terrorist act to change the complexion of the world economies.
Could it hasten the coming correction we have been discussing? well of course it could, but understand it was ALREADY in motion as others will say it was oil or it was this tragic act of violence.
Volume so far is not blowout, more sedate than one would imagine, those bullish will not change their minds over this, but figure it a buying opportunity.
Those of us concerned with dividend yields and valuations have either been severely picky about longs or on sidelines in cash of treasuries and maybe some gold.
Puts out numbering calls and VIX rising, but FAR from signaling any kind of emotional crescendo.
EWT thinks a 3rd of a 3rd wave has begun with STRONG declines possible during its duration.
It is IMHO, VERY LIKELY the TOP is already in this cyclical bull market, Bob Brinker and others disagree. I respect those dissenting opinions.....but I also know what other bear bottoms looked like. lest us not forget that.
Let's not jump to any conclusions just yet, let's watch the action and volume, with Richard Russell's PTI still in bullish reading, anything is posisble.
I see where yields have risen back above 4% recovering some half of thier gains, and I wonder if for the short term we have seen the lows in yields....this yet to be determined.
Duratek
TIME LINE OF EXPLOSIONS IN LONDON!!
6 BLASTS ROCK LONDON Terorists suspected.
I am saddend by this, if ALQueda.......a brutal reminder they are still out there somehwere wanting to attack us.
D
I am saddend by this, if ALQueda.......a brutal reminder they are still out there somehwere wanting to attack us.
D
Wednesday, July 06, 2005
DEVIL IN THE DETAILS
Auto Discounts Help Boost Service Sector
Wed 2:05PM ET - AP
The huge discounts automakers offered on new cars last month did more than clear out dealers' inventory -- they helped boost activity in the nation's service sector at a faster than expected pace.
**SO basically, like aircraft orders, discounts helped an otherwise DECLINING situation look better than actually is.
DEVIL in the details DEVIL!
**SO, we continue to borrow from future deman at the cost of future profits, or any profits at all. Now other big 2 must match. YET, Honda, Toyota etc see NO need to give away the farm to make a sale.
It is an issue of quality over price.
It stinks of desperation.
D
Wed 2:05PM ET - AP
The huge discounts automakers offered on new cars last month did more than clear out dealers' inventory -- they helped boost activity in the nation's service sector at a faster than expected pace.
**SO basically, like aircraft orders, discounts helped an otherwise DECLINING situation look better than actually is.
DEVIL in the details DEVIL!
**SO, we continue to borrow from future deman at the cost of future profits, or any profits at all. Now other big 2 must match. YET, Honda, Toyota etc see NO need to give away the farm to make a sale.
It is an issue of quality over price.
It stinks of desperation.
D
ONION PEELED ON US FACTORY ORDERS
U.S. Factory Orders Rose 2.9% in May; Ex-Trans. Fell 0.1%
July 5 (Bloomberg) -- U.S. factory orders increased in May by the most in a year, mainly due to a surge in bookings for commercial aircraft. Demand for business equipment declined for a third month in four.
Factories received 2.9 percent more orders during the month, the Commerce Department said today in Washington. The rise followed a 0.7 percent increase in April. Excluding transportation equipment, orders declined 0.1 percent after decreasing 0.4 percent.
New high for the move in FTSE not confirmed by RSI or MACD showing slight BEARISH divergence (lower highs), could be close to a top.
European markets opened higher, so I imagine we get some green before 10 AM data on services.
LOOK at GROSS divergence in RSI and MACD on the important indicator , the SPX/VIX ratio even to a layman is NOT poised at beginning of an uptrend, but historically speaking putting the finishing touches which will turn out to be an excellent indicator of a MAJOR TOP being put in place. IMHO
BWDIK?
Duratek
D
July 5 (Bloomberg) -- U.S. factory orders increased in May by the most in a year, mainly due to a surge in bookings for commercial aircraft. Demand for business equipment declined for a third month in four.
Factories received 2.9 percent more orders during the month, the Commerce Department said today in Washington. The rise followed a 0.7 percent increase in April. Excluding transportation equipment, orders declined 0.1 percent after decreasing 0.4 percent.
New high for the move in FTSE not confirmed by RSI or MACD showing slight BEARISH divergence (lower highs), could be close to a top.
European markets opened higher, so I imagine we get some green before 10 AM data on services.
LOOK at GROSS divergence in RSI and MACD on the important indicator , the SPX/VIX ratio even to a layman is NOT poised at beginning of an uptrend, but historically speaking putting the finishing touches which will turn out to be an excellent indicator of a MAJOR TOP being put in place. IMHO
BWDIK?
Duratek
D
Tuesday, July 05, 2005
Today's Action and a piece on Housing SPeculation
What would it take to excite me, impress me? More than a manufacturing report where all the gains come from aircraft sales. The basic economy isnot as healthy as it is being reported. IMHO SO, for now, 6 months into 2005, not too impressed.
Housing Speculation is More Rampant Than You Think
By: Peter Schiff, Euro Pacific Capital, Inc.
As the “debate” over the existence of a housing bubble intensifies, both sides are likely to be proven wrong when it comes to predictions for housing declines should the bubble burst. Most bubble advocates believe that rather than collapsing, housing prices will either rise more slowly, fall slightly, or simply stop going up, thereby allowing stagnant incomes to catch up with surging prices. However, a closer look at the facts reveals it is far more likely to burst with as big a bang as did the NASDAQ five years ago.
One of the main arguments (more wishful thinking than reasoned perspective) against a precipitous drop is that homeowners will not quickly unload houses in the same manner stock investors bailed out of losing equity positions. For example, Treasury Secretary John Snow recently argued against the existence of a housing bubble by claiming, “houses are not like stocks, pork bellies, or gold, and are therefore not prone to bubbles.” He claimed that unlike buyers of those other assets, Americans are buying houses because everyone knows that houses are great investments. Setting aside the self-serving nature of his dismissal of even the possibility of a housing bubble, his comments ironically provided some of the most convincing evidence in support of a housing bubble that I have ever heard.
One reason few expect housing prices to collapse is the mentality that homeowners need to live somewhere and as such will be reluctant to sell their residences. This argument ignores that fact that so many of today’s homebuyers do not occupy their properties as primary residences, and that relatively attractive rentals provide homeowners with viable, none-ownership alternatives for shelter. However, a more in-depth analysis reveals that contrary to prevailing rhetoric, housing speculation is not only rampant, but also far more pervasive than the data suggests, perhaps even more widespread than was the case with tech stocks during the NASDAQ bubble.
According to a recent study by the National Association of Realtors, 23% of homebuyers specifically identified their purchases as investments. Another 13% identified their purchases as vacation properties. Since rental yields are so low, those buying properties as investments are by definition speculating. However, buyers of vacation homes, are also speculating, as inherent in the decision to buy such properties is the expectation of price appreciation. Absent such a forecast, it is far more economical to vacation in hotels. Further, as owners of rental or vacation properties do not occupy their properties as principal residences, a change in sentiment as to future price appreciation could easily cause such owners to sell, or worse, to walk away from mortgages in circumstances of negative equity.
However, the mere fact that owners occupy their houses as principle residences does not necessarily remove such properties from the category of speculative investments. For example, 58% of recent California homebuyers financed their purchases using ARMs (with percentages in pricier counties exceeding 80%). The primary reason given to justify such mortgages was owners’ intentions to resell the properties in relatively short periods of time. Such buying is clearly speculative, regardless of the speculator’s intention to occupy the property. Given high transaction costs and low relative rents available in markets where such mortgages are most pervasive, absent the expectation of rapid price appreciation, such short-term buyers would clearly be better off renting.
Also, the fact that so many buyers are using interest-only, or negative-amortization mortgages, suggests even greater degrees of speculation. Since none of the monthly payments on such loans reduce the principal of the mortgages, buyers utilizing them are no better off than renters. However, since they must also pay property taxes and maintenance, interest only buyers actually get the worst of both worlds. They rent property from lenders, yet get stuck with all the headaches associated with ownership. The only way interest-only buyers build equity is though price appreciation. In other words, they are the ultimate speculators.
The reasons for such unbridled, rampant speculation are clear. According to the Economist, a recent survey showed that the Los Angeles homebuyers expected an average 22% annual home price appreciation over the next 10 years. Given that medium home prices in Los Angeles already exceeds $500,000, such an appreciation rate would lift that figure to over 3.6 million, providing homeowners with over $300,000 per year in annual “income” simply because they own a house (tax free if they extract those gains though debt). Such unrealistic expectations provide compelling incentives to buy. It also helps explain why homeowners are willing to devote record high percentages of their current incomes to covering mortgage payments. When price appreciation is expected to produce annual “income” ten times greater than mortgage payments, the expected cost of such loans is zero. The new “reality” for many homebuyers is that rather than regarding homes as expenses, they rely on them as sources of income.
With current medium home prices in Los Angeles already ten times medium family income of approximately $50,000, one wonders just how typical Angelinos can afford to buy. The short answer is, they can’t. That is why such a large percentage choose interest only mortgages. Again, since interest-only mortgages require no repayment of principle, borrowers are not really buying, since they will never actually own their homes. Such loans merely enable borrowers to pretend to buy houses that they cannot actually afford. Thus the illusions of legitimate home values and the sustainability of future price increases are maintained.
In fact, so intoxicating is the expected payoff from home ownership, that the incentives to lie to qualify for mortgages have never been greater, and as it so conveniently happens, easier to do. Trendy no-documentation mortgages allow almost anyone to buy a house, regardless of employment status, income, financial condition, or credit history. The fact that purchases can also be financed with zero down, means that speculators can gamble with no risk what-so-ever should prices fall. Also, the availability of cash-out refinancing means that owners can press their bets while simultaneously taking their winnings off the table.
Given such incentives, is it any wonder that housing speculation is so rampant? Should we be amazed that when reckless lenders offer buyers can’t lose bets, with huge expected payoffs, that so many want a piece of the action? The fact that the majority of today’s homebuyers are actually speculators in disguise, suggests that when the trend turns, prices will drop precipitously. Far from holding on to their homes, as even most housing bears suggest, owner/speculators will sell in droves, or worse, simply walk away from their bets, leaving lenders and tax payers to cover their losses. -- Posted Tuesday, 5 July 2005
- Peter Schiff C.E.O. and Chief Global StrategistMr. Schiff is one of the few non-biased investment advisors (not committed solely to the short side of the market) to have correctly called the current bear market before it began and to have positioned his clients accordingly. As a result of his accurate forecasts on the U.S. stock market, commodities, gold and the dollar, he is becoming increasingly more renowned. He has been quoted in many of the nation's leading newspapers, including The Wall Street Journal, Barron's, Investor's Business Daily, The Financial Times, The New York Times, The Los Angeles Times, The Washington Post, The Chicago Tribune, The Dallas Morning News, The Miami Herald, The San Francisco Chronicle, The Atlanta Journal-Constitution, The Arizona Republic, The Philadelphia Inquirer, and the Christian Science Monitor, and has appeared on CNBC, CNNfn., and Bloomberg. In addition, his views are frequently quoted locally in the Orange County Register. Mr. Schiff began his investment career as a financial consultant with Shearson Lehman Brothers, after having earned a degree in finance and accounting from U.C. Berkley in 1987. A financial professional for seventeen years he joined Euro Pacific in 1996 and has served as its President since January 2000. An expert on money, economic theory, and international investing, he is a highly recommended broker by many of the nation's financial newsletters and advisory services. Previous Articles by Peter Schiff, Euro Pacific Capital, Inc.
Housing Speculation is More Rampant Than You Think
By: Peter Schiff, Euro Pacific Capital, Inc.
As the “debate” over the existence of a housing bubble intensifies, both sides are likely to be proven wrong when it comes to predictions for housing declines should the bubble burst. Most bubble advocates believe that rather than collapsing, housing prices will either rise more slowly, fall slightly, or simply stop going up, thereby allowing stagnant incomes to catch up with surging prices. However, a closer look at the facts reveals it is far more likely to burst with as big a bang as did the NASDAQ five years ago.
One of the main arguments (more wishful thinking than reasoned perspective) against a precipitous drop is that homeowners will not quickly unload houses in the same manner stock investors bailed out of losing equity positions. For example, Treasury Secretary John Snow recently argued against the existence of a housing bubble by claiming, “houses are not like stocks, pork bellies, or gold, and are therefore not prone to bubbles.” He claimed that unlike buyers of those other assets, Americans are buying houses because everyone knows that houses are great investments. Setting aside the self-serving nature of his dismissal of even the possibility of a housing bubble, his comments ironically provided some of the most convincing evidence in support of a housing bubble that I have ever heard.
One reason few expect housing prices to collapse is the mentality that homeowners need to live somewhere and as such will be reluctant to sell their residences. This argument ignores that fact that so many of today’s homebuyers do not occupy their properties as primary residences, and that relatively attractive rentals provide homeowners with viable, none-ownership alternatives for shelter. However, a more in-depth analysis reveals that contrary to prevailing rhetoric, housing speculation is not only rampant, but also far more pervasive than the data suggests, perhaps even more widespread than was the case with tech stocks during the NASDAQ bubble.
According to a recent study by the National Association of Realtors, 23% of homebuyers specifically identified their purchases as investments. Another 13% identified their purchases as vacation properties. Since rental yields are so low, those buying properties as investments are by definition speculating. However, buyers of vacation homes, are also speculating, as inherent in the decision to buy such properties is the expectation of price appreciation. Absent such a forecast, it is far more economical to vacation in hotels. Further, as owners of rental or vacation properties do not occupy their properties as principal residences, a change in sentiment as to future price appreciation could easily cause such owners to sell, or worse, to walk away from mortgages in circumstances of negative equity.
However, the mere fact that owners occupy their houses as principle residences does not necessarily remove such properties from the category of speculative investments. For example, 58% of recent California homebuyers financed their purchases using ARMs (with percentages in pricier counties exceeding 80%). The primary reason given to justify such mortgages was owners’ intentions to resell the properties in relatively short periods of time. Such buying is clearly speculative, regardless of the speculator’s intention to occupy the property. Given high transaction costs and low relative rents available in markets where such mortgages are most pervasive, absent the expectation of rapid price appreciation, such short-term buyers would clearly be better off renting.
Also, the fact that so many buyers are using interest-only, or negative-amortization mortgages, suggests even greater degrees of speculation. Since none of the monthly payments on such loans reduce the principal of the mortgages, buyers utilizing them are no better off than renters. However, since they must also pay property taxes and maintenance, interest only buyers actually get the worst of both worlds. They rent property from lenders, yet get stuck with all the headaches associated with ownership. The only way interest-only buyers build equity is though price appreciation. In other words, they are the ultimate speculators.
The reasons for such unbridled, rampant speculation are clear. According to the Economist, a recent survey showed that the Los Angeles homebuyers expected an average 22% annual home price appreciation over the next 10 years. Given that medium home prices in Los Angeles already exceeds $500,000, such an appreciation rate would lift that figure to over 3.6 million, providing homeowners with over $300,000 per year in annual “income” simply because they own a house (tax free if they extract those gains though debt). Such unrealistic expectations provide compelling incentives to buy. It also helps explain why homeowners are willing to devote record high percentages of their current incomes to covering mortgage payments. When price appreciation is expected to produce annual “income” ten times greater than mortgage payments, the expected cost of such loans is zero. The new “reality” for many homebuyers is that rather than regarding homes as expenses, they rely on them as sources of income.
With current medium home prices in Los Angeles already ten times medium family income of approximately $50,000, one wonders just how typical Angelinos can afford to buy. The short answer is, they can’t. That is why such a large percentage choose interest only mortgages. Again, since interest-only mortgages require no repayment of principle, borrowers are not really buying, since they will never actually own their homes. Such loans merely enable borrowers to pretend to buy houses that they cannot actually afford. Thus the illusions of legitimate home values and the sustainability of future price increases are maintained.
In fact, so intoxicating is the expected payoff from home ownership, that the incentives to lie to qualify for mortgages have never been greater, and as it so conveniently happens, easier to do. Trendy no-documentation mortgages allow almost anyone to buy a house, regardless of employment status, income, financial condition, or credit history. The fact that purchases can also be financed with zero down, means that speculators can gamble with no risk what-so-ever should prices fall. Also, the availability of cash-out refinancing means that owners can press their bets while simultaneously taking their winnings off the table.
Given such incentives, is it any wonder that housing speculation is so rampant? Should we be amazed that when reckless lenders offer buyers can’t lose bets, with huge expected payoffs, that so many want a piece of the action? The fact that the majority of today’s homebuyers are actually speculators in disguise, suggests that when the trend turns, prices will drop precipitously. Far from holding on to their homes, as even most housing bears suggest, owner/speculators will sell in droves, or worse, simply walk away from their bets, leaving lenders and tax payers to cover their losses. -- Posted Tuesday, 5 July 2005
- Peter Schiff C.E.O. and Chief Global StrategistMr. Schiff is one of the few non-biased investment advisors (not committed solely to the short side of the market) to have correctly called the current bear market before it began and to have positioned his clients accordingly. As a result of his accurate forecasts on the U.S. stock market, commodities, gold and the dollar, he is becoming increasingly more renowned. He has been quoted in many of the nation's leading newspapers, including The Wall Street Journal, Barron's, Investor's Business Daily, The Financial Times, The New York Times, The Los Angeles Times, The Washington Post, The Chicago Tribune, The Dallas Morning News, The Miami Herald, The San Francisco Chronicle, The Atlanta Journal-Constitution, The Arizona Republic, The Philadelphia Inquirer, and the Christian Science Monitor, and has appeared on CNBC, CNNfn., and Bloomberg. In addition, his views are frequently quoted locally in the Orange County Register. Mr. Schiff began his investment career as a financial consultant with Shearson Lehman Brothers, after having earned a degree in finance and accounting from U.C. Berkley in 1987. A financial professional for seventeen years he joined Euro Pacific in 1996 and has served as its President since January 2000. An expert on money, economic theory, and international investing, he is a highly recommended broker by many of the nation's financial newsletters and advisory services. Previous Articles by Peter Schiff, Euro Pacific Capital, Inc.
HEDONIC INFLATING OF US ECONOMIC GROWTH
America's recovery is not what it seems
By Kurt Richebacher
FT.com site; Sep 04, 2003
American economic recovery is the world's great hope. So there was widespread satisfaction when the US Commerce Department last week revised its estimate of annual growth in the second quarter to 3.1 per cent, up from an earlier estimate of 2.4 per cent. A closer look at the numbers, however, tells a somewhat gloomier story.
Much of the growth in gross domestic product is due to a big jump in defence spending, which provided $40.6bn of the reported GDP growth of $73.1bn. Yet while the commerce department and some media reports noted that defence spending had risen by 44 per cent at an annual rate, many commentators failed to mention its role in raising GDP growth. All too often nowadays, new economic data are examined with a single question in mind: are they better than expected? Close analysis with a longer-term perspective is in short supply.
Still, the commerce department report seemed to contain good news on capital investment. "Real non- residential fixed investment increased 6.9 per cent in the second quarter, in contrast to a decrease of 4.4 per cent in the first," it said. "Non-residential structures increased 4.8 per cent, in contrast to a decrease of 2.9 per cent. Equipment and software increased by 7.5 per cent, in contrast to a decrease of 4.8 per cent. Real residential fixed investment increased 6 per cent, compared with an increase of 10.1 per cent." These numbers suggest a vigorous turn in capital spending. However, their strength owes a lot to the singular US habit of annualising many figures. Quarterly data, in other words, are about four times the reality that would be reported in other countries.
So what exactly did happen in the private sector? Consumption increased by $62.5bn and business fixed investment - vital for a robust, self-sustaining recovery - by $22.4bn.
A single component of business fixed investment accounted for more than its overall increase. Investment in computers soared by $38.4bn, or 12 per cent, from $319.1bn to $357.5bn.
The trouble is that much of this boom-like increase in computer investment never occurred. The apparent surge is a consequence of the hedonic deflator that US government statisticians use when measuring computer output and investment. The aim is to capture quality improvements by calculating how much it would have cost in 1996 to buy a computer of equivalent power to today's machines.
Measured in current dollars, however, this spending rose a lacklustre $6.3bn, from $76.3bn in the previous quarter to $82.6bn - far below previous peak levels. In other words, hedonic pricing produced $32.1bn of GDP in real terms, about 43.9 per cent of the reported second-quarter GDP increase of $73.1bn. In its absence, GDP would have grown a mere $41bn, implying a growth rate of 1.68 per cent. The important thing about hedonic pricing is that it measures dollars that nobody pays and nobody receives. And it grossly distorts international comparisons.
Recessions and times of slow growth are when businesses and consumers normally retrench, correcting boom-time spending excesses. A full-scale recovery, in turn, requires the economy's return to a sustainable pattern of consumption, investment and saving.
None of these adjustments is happening in the US. Alan Greenspan, the Federal Reserve chairman, has been fighting the consequences of excessive monetary looseness with still more of the same. Inevitably, economic and financial fundamentals, such as profits, national savings, debt levels, balance sheets and the trade deficit, continue to deteriorate across the board.
Profits, as calculated in the GDP and income accounts, are down again. Total before-tax profits were $591.5bn in the second quarter, compared with $621.6bn in the first quarter. Non- financial profits were $359.2bn, after $391.3bn in the first quarter. As div- idends are rising while profits fall, credit-financed dividends have soared in the non-financial sector to $102.8bn.
The private sector's strength derived completely from bubble-driven consumer spending. But that bubble has been pricked by the sharp rise in long-term interest rates. Mortgage re- financing activity is falling sharply.
Mr Greenspan has turned bubble creation into a virtue. In days of yore, asset prices were viewed as a by- product of underlying economic conditions. Now, by contrast, the real economy is heavily dependent on asset inflation to fuel borrowing and spending. These conditions are more favourable to recession than to recovery.
By Kurt Richebacher
FT.com site; Sep 04, 2003
American economic recovery is the world's great hope. So there was widespread satisfaction when the US Commerce Department last week revised its estimate of annual growth in the second quarter to 3.1 per cent, up from an earlier estimate of 2.4 per cent. A closer look at the numbers, however, tells a somewhat gloomier story.
Much of the growth in gross domestic product is due to a big jump in defence spending, which provided $40.6bn of the reported GDP growth of $73.1bn. Yet while the commerce department and some media reports noted that defence spending had risen by 44 per cent at an annual rate, many commentators failed to mention its role in raising GDP growth. All too often nowadays, new economic data are examined with a single question in mind: are they better than expected? Close analysis with a longer-term perspective is in short supply.
Still, the commerce department report seemed to contain good news on capital investment. "Real non- residential fixed investment increased 6.9 per cent in the second quarter, in contrast to a decrease of 4.4 per cent in the first," it said. "Non-residential structures increased 4.8 per cent, in contrast to a decrease of 2.9 per cent. Equipment and software increased by 7.5 per cent, in contrast to a decrease of 4.8 per cent. Real residential fixed investment increased 6 per cent, compared with an increase of 10.1 per cent." These numbers suggest a vigorous turn in capital spending. However, their strength owes a lot to the singular US habit of annualising many figures. Quarterly data, in other words, are about four times the reality that would be reported in other countries.
So what exactly did happen in the private sector? Consumption increased by $62.5bn and business fixed investment - vital for a robust, self-sustaining recovery - by $22.4bn.
A single component of business fixed investment accounted for more than its overall increase. Investment in computers soared by $38.4bn, or 12 per cent, from $319.1bn to $357.5bn.
The trouble is that much of this boom-like increase in computer investment never occurred. The apparent surge is a consequence of the hedonic deflator that US government statisticians use when measuring computer output and investment. The aim is to capture quality improvements by calculating how much it would have cost in 1996 to buy a computer of equivalent power to today's machines.
Measured in current dollars, however, this spending rose a lacklustre $6.3bn, from $76.3bn in the previous quarter to $82.6bn - far below previous peak levels. In other words, hedonic pricing produced $32.1bn of GDP in real terms, about 43.9 per cent of the reported second-quarter GDP increase of $73.1bn. In its absence, GDP would have grown a mere $41bn, implying a growth rate of 1.68 per cent. The important thing about hedonic pricing is that it measures dollars that nobody pays and nobody receives. And it grossly distorts international comparisons.
Recessions and times of slow growth are when businesses and consumers normally retrench, correcting boom-time spending excesses. A full-scale recovery, in turn, requires the economy's return to a sustainable pattern of consumption, investment and saving.
None of these adjustments is happening in the US. Alan Greenspan, the Federal Reserve chairman, has been fighting the consequences of excessive monetary looseness with still more of the same. Inevitably, economic and financial fundamentals, such as profits, national savings, debt levels, balance sheets and the trade deficit, continue to deteriorate across the board.
Profits, as calculated in the GDP and income accounts, are down again. Total before-tax profits were $591.5bn in the second quarter, compared with $621.6bn in the first quarter. Non- financial profits were $359.2bn, after $391.3bn in the first quarter. As div- idends are rising while profits fall, credit-financed dividends have soared in the non-financial sector to $102.8bn.
The private sector's strength derived completely from bubble-driven consumer spending. But that bubble has been pricked by the sharp rise in long-term interest rates. Mortgage re- financing activity is falling sharply.
Mr Greenspan has turned bubble creation into a virtue. In days of yore, asset prices were viewed as a by- product of underlying economic conditions. Now, by contrast, the real economy is heavily dependent on asset inflation to fuel borrowing and spending. These conditions are more favourable to recession than to recovery.
CORPORATE PROFITS SLOWING
Profit Growth Slowing Bloomberg story
"While stocks lacked direction, optimism about the market reached a three-month high. Fifty-five percent of newsletter writers were bullish, according to an Investors Intelligence survey completed June 24."
My previous weekend post sites the record bullishness that has taken place for last 5 years, especially the last 2 1/2.
And go back and read my July 1 post on stock options MUST be expensed , will pressure high tech earnings or lack there of.
Rising earnings, and the hope of such give some fuel for rising prices, the opposite of course.....
AVG JOE, I wanna be a rock star, big brother, fear factor, big loser,I wanna be a hilton, hulk hogan's way, gilligans's island, and on and on and on......give me a break!
Duratek
"While stocks lacked direction, optimism about the market reached a three-month high. Fifty-five percent of newsletter writers were bullish, according to an Investors Intelligence survey completed June 24."
My previous weekend post sites the record bullishness that has taken place for last 5 years, especially the last 2 1/2.
And go back and read my July 1 post on stock options MUST be expensed , will pressure high tech earnings or lack there of.
Rising earnings, and the hope of such give some fuel for rising prices, the opposite of course.....
AVG JOE, I wanna be a rock star, big brother, fear factor, big loser,I wanna be a hilton, hulk hogan's way, gilligans's island, and on and on and on......give me a break!
Duratek
Monday, July 04, 2005
SPX PROFITS SLOWING?
CNN says is that why market has been hesitant to challenge recent highs? ALSO, stock options as expenses are coming and will HUR TECH in a bad way
D
D
AT THE TOP......LOOKING DOWN
Maybe people only believe when hindsight is added, and that would be a shame, but there is enough data and info out there to come to a logical conclusion as to what may lie ahead.
The engine for this economic "rebound" has near exhausted itself. When you start reading articles about how higher property taxes (this AM CNN) are hurting home owners, especially strapped first time buyers in the areas most effected you gotta wonder how much further it can run.
Price appreciation has not only stalled but median home values have been declining. Cashouts have come and gone and are spent.
30% or more of homes sold have been for speculation I have read.....housing has replaced the stock market....it's just another bear trap.....as just like soaring NASDAQ shares did not elicit a murmur of concern, nor do the present day housing bubble....as AGAIN it is staring them in the kisser.
ODD FACTOID (from July EWFF) OTC Bulletin Board "shares" traded has almost tripled from its 2000 highs!!!!! THIS DURING the 5 year period of and after the initial phase of WICKED BEAR MKT!!
BUT.......$$$$ DOLLAR value of those shares was only 25% of previous top! BAMMM! double BAMM!WHY THE PLAY of UNLISTED shares? indeed.
140 continuous weeks of Investor Intelligence polls of more bulls than bears! WHERE was the capitulation during the bear market? there was none.
VIX/SPX ratio also hit new highs 20% above previous bubble highs....3 X since 2004.
The 13 weeks avg of bulls is 69% !!!! WHAT A TOP is forming, IMHO a MAJOR TOP not to be seen again for perhaps a decade or more!
Last BEAR bottom saw 40 plus weeks of BEARS PLURALITY!! in all of last 5 years I think it was total of 9.
Silver has broken down, I think gold will follow...holders of gold have not made a dime in over 20 years and have not earned a thin dime of interest....I think gold shares will be cast off with the rest in the coming bear decline. (potentially offering a HUGE buying opp) gold hasn;t even bettered its last top, and the chart of bellweather NEM looks awful, IMHO
IMHO gold (if they own any) among other things will have to be sold off to raise $$$$'s to pay debts (at historical highs)....why 100.00 EWT target for the US $$ is possible among other things. How does this make venerable GURU Warren Buffet look?
Threat of protectionism against Chinese.
With SO many extreme readings, like credit expansion debt housing etc.....THIS is NOT a platform to VAULT or start next level of a bull market......no what we see LOW VIX etc is what the bear can feast on for months on end.
Duratek
The engine for this economic "rebound" has near exhausted itself. When you start reading articles about how higher property taxes (this AM CNN) are hurting home owners, especially strapped first time buyers in the areas most effected you gotta wonder how much further it can run.
Price appreciation has not only stalled but median home values have been declining. Cashouts have come and gone and are spent.
30% or more of homes sold have been for speculation I have read.....housing has replaced the stock market....it's just another bear trap.....as just like soaring NASDAQ shares did not elicit a murmur of concern, nor do the present day housing bubble....as AGAIN it is staring them in the kisser.
ODD FACTOID (from July EWFF) OTC Bulletin Board "shares" traded has almost tripled from its 2000 highs!!!!! THIS DURING the 5 year period of and after the initial phase of WICKED BEAR MKT!!
BUT.......$$$$ DOLLAR value of those shares was only 25% of previous top! BAMMM! double BAMM!WHY THE PLAY of UNLISTED shares? indeed.
140 continuous weeks of Investor Intelligence polls of more bulls than bears! WHERE was the capitulation during the bear market? there was none.
VIX/SPX ratio also hit new highs 20% above previous bubble highs....3 X since 2004.
The 13 weeks avg of bulls is 69% !!!! WHAT A TOP is forming, IMHO a MAJOR TOP not to be seen again for perhaps a decade or more!
Last BEAR bottom saw 40 plus weeks of BEARS PLURALITY!! in all of last 5 years I think it was total of 9.
Silver has broken down, I think gold will follow...holders of gold have not made a dime in over 20 years and have not earned a thin dime of interest....I think gold shares will be cast off with the rest in the coming bear decline. (potentially offering a HUGE buying opp) gold hasn;t even bettered its last top, and the chart of bellweather NEM looks awful, IMHO
IMHO gold (if they own any) among other things will have to be sold off to raise $$$$'s to pay debts (at historical highs)....why 100.00 EWT target for the US $$ is possible among other things. How does this make venerable GURU Warren Buffet look?
Threat of protectionism against Chinese.
With SO many extreme readings, like credit expansion debt housing etc.....THIS is NOT a platform to VAULT or start next level of a bull market......no what we see LOW VIX etc is what the bear can feast on for months on end.
Duratek
PROPERY TAXES RISE
One of the things I have said are adding to the burden and siphoning from consumer spending.
http://news.yahoo.com/s/ap/20050703/ap_on_re_us/property_tax_squeeze
http://news.yahoo.com/s/ap/20050703/ap_on_re_us/property_tax_squeeze
Saturday, July 02, 2005
WEEKEND THOUGHTS JULY 2nd
Markets were volume-less as I suggested on getaway Friday, markets in the US will be closed on July 4th Monday. (Creed "Weathered" playing as I post)
Complacency markers screaming at extreme readings, the market IMHO has VERY upside potential for the remainder of 2005, the year ending in FIVE at risk for posting its first historical yearly loss.
As I have pointed out on several occasions the SPX/VIX Ratio remains at historic highs, ABOVE previous levels only seen at 1999-2000 BUBBLE extremes.........shouldn't we conclude that is reason for EXTREME caution? SHould we conclude this is meanignless? Or should we have our SPidey sense TINGLING with CAUTION, DANGER Will RObinson.........something wicked this way comes? Or should an investor just "let it ride" with LTBH mentality?
WE BUY and HOLD during GREAT BUYING OPPS, when stocks are found at GREAT BARGAINS. One of those times (though SPX PE was near 30) was end of 2002 after 3 years of selling and several selling climaxes found with VIX NORTH of 40. THEN we additional data a change was coming and SECULAR BEAR was going to hibernate when 50 SMA's moved above the 200 SMA's then BOTH TURNED UP, these were not found present during ALL of ugly bear.......but with FEAR HIGH (even though typical exit volume not found nor 90% selling climaxes) MOST couldn't pull the trigger.
Unfortunately, neither PE ratio's or (Now have playing Death Cab "Tiny Vessels") dividend yields matched ANY prior Bear MArket lows.....so we MUST conclude rise from 2002-2003 was/is a Cyclical Bull market correction of the entire Prior Bear MArket.
Its job was to seperate PHASE ONE from PHASE TWO of perhaps a HISTORICAL SECULAR BEAR MARKET thathas much work to do. You DO NOT want to be holding stocks in general IMHO should this be true and accurate conclusion.
GOLD fell HARD FRIDAY, it has been clear to me that with SILVER declining there was NO upside confirmation for this move in gold, NO GOLD BUG, Russell nor anyone I read bothered to mention this fact. Nor did they mention the declining tops and lower lows in bell weather NEMONT MINING, and weak and non confirming MACD and RSI readings.....though there asessment regarding the printing of money is correct, other things more powerful are at work here.
My previous posts from Privateer were meant to show how it takes INCREASINGLY MORE money printed to get even far lesser results, so ......it is like a BLACK HOLE.....the gravity of deflationary tendencies are too great to escape I am afraid.
Friday showed unusual strength in GOLD SHARES VS physical gold, IMHO this was a bearish divergence only showing the extent gold bugs are ignoring the trendd, and the shares are soon to follow the metals DOWN. WHEN the next phase in the gold BULL (still not sure if there is one) begins, it will have begun without many current holders holding. (ColdPLay "Warning Sign" now playing seems appropriate)
Those with large cash holdings and little or NO debt will be survivors with few nicks, but we shall all lsoe something should history be indeed be ready to repeat itself.....g-d help us all.
1929 seems like FOREVER AGO! can't happen again? BS
The 70 YEAR cycle of the Kondratief WINTER has been DELAYED by reckless and feckless FED action to try and CHEAT the BEAR, it has only made the BEAR more hungry.
We have seen EXTREMES in SO MANY AREAS!!!!!! 5 year highs one after another in housing. PARABOLIC in SALES and PRICING. PARABOLIC moves in commodities and certain stocks. A move to $300 by GOOG an $84 B company? It appears the top is in on GOOG, it has reversed IMHO.
Credit expansion and debt is above any other known extreme. (Now Echo and Bunneymen "Flowers" SOOOO GOOOOOOD) DO we want to invest LTBH when so many extremes seem to have topped or at least are above any other know extreme?
I have been waiting patiently, stepping aside near 100% cash....wondering if I have been right all these years.
I DO know this, I OWN my opinion, I have researched and spend countless hours thinking about it, and I end with same conclusion.......the Bear MArket which began in 2000 is FAR from over.
WHY?
because it hasn't achieved anything close to prior 3 bear markets, and I don't like the odds of this bear diverging from the path any of the prior bear markets have taken to reach a LASTING SOLID BOTTOM.
My attempts will be to not be taken under before that day comes andnot to be in a state of shock and bewildered to the point I CANNOT recognize a historic buying opportunity that may never come along again in my lifetime.
Lows below any known values seen in recent history or last seen at prior bear mkt bottoms. NEAR SINGLE DIGIT SPX PE RATIO AND DIVIDEND YIELDS APPROACHING OR EXCEEDING 6%.
TRADING SHORT TERM TRENDS for those nimble are fine, otherwise caution is word of the day.
I am attempting to time next high in yields, and hope to enter 10 year treasuries near their highs in yield, as INCOME becomes the next extreme to hit the streets or the desire for it. BONDS have been in 20 year plus bull market, it doesn't appear over yet, but a correction is under way.
We could also spread out cash between short term notes 30, 60 and 90 day etc to always have something coming due and perhaps roll it over. This comes without risk and provides SOME yield. IMHO
Possible short term rally attempt next week.......I will be looking for another triple digit decline as a signal business as usual is over. A drop below 10K psych level could be significant.
We have significantly borrorwed against future growth in Housing and Auto's (now offering prices at EMPLOYEE DISCOUNTS) to make a sustainable economy going forward very difficult IMHO. .....especially if the GOV begins to cut spending. We have potential trade war with CHina looming with subsequent protectionist policies possible. (oil takeover attempt by Chinese GOV front)
Duratek
Complacency markers screaming at extreme readings, the market IMHO has VERY upside potential for the remainder of 2005, the year ending in FIVE at risk for posting its first historical yearly loss.
As I have pointed out on several occasions the SPX/VIX Ratio remains at historic highs, ABOVE previous levels only seen at 1999-2000 BUBBLE extremes.........shouldn't we conclude that is reason for EXTREME caution? SHould we conclude this is meanignless? Or should we have our SPidey sense TINGLING with CAUTION, DANGER Will RObinson.........something wicked this way comes? Or should an investor just "let it ride" with LTBH mentality?
WE BUY and HOLD during GREAT BUYING OPPS, when stocks are found at GREAT BARGAINS. One of those times (though SPX PE was near 30) was end of 2002 after 3 years of selling and several selling climaxes found with VIX NORTH of 40. THEN we additional data a change was coming and SECULAR BEAR was going to hibernate when 50 SMA's moved above the 200 SMA's then BOTH TURNED UP, these were not found present during ALL of ugly bear.......but with FEAR HIGH (even though typical exit volume not found nor 90% selling climaxes) MOST couldn't pull the trigger.
Unfortunately, neither PE ratio's or (Now have playing Death Cab "Tiny Vessels") dividend yields matched ANY prior Bear MArket lows.....so we MUST conclude rise from 2002-2003 was/is a Cyclical Bull market correction of the entire Prior Bear MArket.
Its job was to seperate PHASE ONE from PHASE TWO of perhaps a HISTORICAL SECULAR BEAR MARKET thathas much work to do. You DO NOT want to be holding stocks in general IMHO should this be true and accurate conclusion.
GOLD fell HARD FRIDAY, it has been clear to me that with SILVER declining there was NO upside confirmation for this move in gold, NO GOLD BUG, Russell nor anyone I read bothered to mention this fact. Nor did they mention the declining tops and lower lows in bell weather NEMONT MINING, and weak and non confirming MACD and RSI readings.....though there asessment regarding the printing of money is correct, other things more powerful are at work here.
My previous posts from Privateer were meant to show how it takes INCREASINGLY MORE money printed to get even far lesser results, so ......it is like a BLACK HOLE.....the gravity of deflationary tendencies are too great to escape I am afraid.
Friday showed unusual strength in GOLD SHARES VS physical gold, IMHO this was a bearish divergence only showing the extent gold bugs are ignoring the trendd, and the shares are soon to follow the metals DOWN. WHEN the next phase in the gold BULL (still not sure if there is one) begins, it will have begun without many current holders holding. (ColdPLay "Warning Sign" now playing seems appropriate)
Those with large cash holdings and little or NO debt will be survivors with few nicks, but we shall all lsoe something should history be indeed be ready to repeat itself.....g-d help us all.
1929 seems like FOREVER AGO! can't happen again? BS
The 70 YEAR cycle of the Kondratief WINTER has been DELAYED by reckless and feckless FED action to try and CHEAT the BEAR, it has only made the BEAR more hungry.
We have seen EXTREMES in SO MANY AREAS!!!!!! 5 year highs one after another in housing. PARABOLIC in SALES and PRICING. PARABOLIC moves in commodities and certain stocks. A move to $300 by GOOG an $84 B company? It appears the top is in on GOOG, it has reversed IMHO.
Credit expansion and debt is above any other known extreme. (Now Echo and Bunneymen "Flowers" SOOOO GOOOOOOD) DO we want to invest LTBH when so many extremes seem to have topped or at least are above any other know extreme?
I have been waiting patiently, stepping aside near 100% cash....wondering if I have been right all these years.
I DO know this, I OWN my opinion, I have researched and spend countless hours thinking about it, and I end with same conclusion.......the Bear MArket which began in 2000 is FAR from over.
WHY?
because it hasn't achieved anything close to prior 3 bear markets, and I don't like the odds of this bear diverging from the path any of the prior bear markets have taken to reach a LASTING SOLID BOTTOM.
My attempts will be to not be taken under before that day comes andnot to be in a state of shock and bewildered to the point I CANNOT recognize a historic buying opportunity that may never come along again in my lifetime.
Lows below any known values seen in recent history or last seen at prior bear mkt bottoms. NEAR SINGLE DIGIT SPX PE RATIO AND DIVIDEND YIELDS APPROACHING OR EXCEEDING 6%.
TRADING SHORT TERM TRENDS for those nimble are fine, otherwise caution is word of the day.
I am attempting to time next high in yields, and hope to enter 10 year treasuries near their highs in yield, as INCOME becomes the next extreme to hit the streets or the desire for it. BONDS have been in 20 year plus bull market, it doesn't appear over yet, but a correction is under way.
We could also spread out cash between short term notes 30, 60 and 90 day etc to always have something coming due and perhaps roll it over. This comes without risk and provides SOME yield. IMHO
Possible short term rally attempt next week.......I will be looking for another triple digit decline as a signal business as usual is over. A drop below 10K psych level could be significant.
We have significantly borrorwed against future growth in Housing and Auto's (now offering prices at EMPLOYEE DISCOUNTS) to make a sustainable economy going forward very difficult IMHO. .....especially if the GOV begins to cut spending. We have potential trade war with CHina looming with subsequent protectionist policies possible. (oil takeover attempt by Chinese GOV front)
Duratek
Friday, July 01, 2005
END THE WEEK WITH 2 FROM BILL BUCKLER
Excerpts from investment rarities site from Privateer BOTH June 9th
BEST OF BILL BUCKLER
June 20, 2005
What passes for economic and monetary theory inside the US today is simplicity itself. It is so basic that even Lord Keynes would blush to see it were he alive today. All it consists of is the idea that when any ongoing credit expansion shows signs of faltering, the solution is to overpower the real economic consequences which are now catching up with an even BIGGER credit expansion.
They even have a "name" for this so-called economic policy. They claim that they are "growing" the economy. If fact, what they are growing is the height of US debt outstanding (internal as well as all the external). No measure is out of bounds. The tax cuts are to enable Americans to service their higher debts. The result is that the US budget deficit has exploded. On top of that, the US has a current account deficit which the OECD expects to reach $US 900 Billion next year…..
Over the week to May 27, US M3 jumped $US 23.8 Billion to $US 9.622 TRILLION.
In one week, the US credit money machine created an additional US $23.8 Billion out of thin air. Those new US Dollars are now in full circulation. If the US Federal Reserve keeps this weekly rate of money creation up for a year it will have added an additional $US 1 TRILLION 237 Billion to the already outstanding stock of money in the US monetary system. This is where the global spill-over starts.
Let The Record Show:
The wider US M3 money supply has grown from $US 7.3 TRILLION at the start of 2001 to $US 9.622 TRILLION through May 2005. Over the mere four and one-half years from the start of 2001, the US money machine has decanted this additional $US 2 TRILLION 322 Billion on top of the pre-existing $US 7.3 TRILLION, which is an increase in the total stock of money in the USA of 31.8 percent in that time!….
The spectre which haunts the world is a sudden and out of control collapse in the international value of the grotesquely politically misused US Dollar. It is, after all, the world's reserve currency! Such a collapse would place under suspicion and ultimately expose every other fiat and credit currency. It would do none of them any good to claim that they had lots of foreign reserves, these are US Dollars!
But if they could point to a huge hoard of Gold, they just might ride out such a storm. As would you, gentle reader, if you just held 15 to 20 percent of your financial assets in Gold.
Ó 2005 – The Privateer
http://www.the-privateer.com
THE SUPPLY OF MONEY - AND THE DEMAND FOR MONEY
Here are some numbers which should make for very sobering reading indeed. They involve the rate of the expansion of the US broad money supply (M3) in the period since May 2004. Don't forget, the Fed began their series of official US rate rises - from a level of 1.0% - at the end of June 2004.
In late May 2004, US M3 was running at a year-to-date expansion rate of 11.0% annualised.
In the first week of June, exactly a year ago, the US M3 rate of expansion over the previous four weeks was reported to be running at a rate of 20% annualised.
In the first week of July 2004, just after the Fed's first 0.25% rate rise, the year-to-date expansion of the US M3 was 10.1% annualised - double the rate of the corresponding period of the previous year.
At the end of 2004, US M3 was reported to have expanded over the year at a rate of 6.6%.
As of June 3, 2005, the US M3 year-to-date expansion rate (to May 23) is reported to be 3.1%.
Finally, since the beginning of 2005 - again up to May 23 (the latest data reported) - US M3 has climbed from $US 9,479.2 Billion to $US 9,599.2 Billion. That's up $US 120 Billion or 1.27%.
As you can clearly see, the rate of expansion of the US "money supply", almost all of which is borrowed into existence, has radically slowed over the past year. This has happened despite the continuing increases in government spending and trade and current account deficits and despite the ongoing real estate mania in the US.
It is an old adage of rational financial economics that once a monetary inflation has begun, it takes ever larger dollops of new inflation to keep the entire structure from imploding. Amongst many other reasons, this is true because as the debt load incurred by the inflation increases, servicing costs for this debt grow. This effect can be delayed, somewhat, by the Central Bank artificially lowering interest rates - as the Fed did in 2001-03, but the effect of this artificial lowering of rates is to accelerate the borrowing. To illustrate this, the highest year-on-year increase in US M3 since 1981 - almost exactly $US 1TRILLION or 12.54% - came in 2001, the year when the Fed cut official US rates from 6.50% to 1.75%.
In August 1982, the start of an almost two-decade stock bull market in the US, US M3 stood at $US 2,400 Billion. It doubled to $US 4,800 by June 1996, just under 14 years later. Now, in the nine years since June 1996, the US M3 has doubled again to its present level of $US 9,600 Billion. There's the acceleration. Now go back and look at the data presented about more recent M3 movements. A year ago, the year-on-year expansion of US M3 was running at an 11.1% rate. Six months ago, it was 6.6%. Today, it is 3.1%. There's the DECELERATION!
Of course, the "stock" explanation of this drastic deceleration in monetary growth is that the Fed has TRIPLED official rates from 1.0% to 3.0% over the past year. Two factors are ignored in this explanation. The first is that the Fed has been offsetting its rate cuts with ever bigger "open market operations" by which it injects new money into the system. The second and more important factor is the drastic flattening of the US "yield curve". On June 3, 2004, the spread between three-month and ten-year Treasury rates was 355 basis points or 3.55%. On June 3, 2005, this spread was down to 99 basis points or 0.99%. The three-month Treasury yield which the Fed DOES control had risen from 1.16% to 2.99%. The ten-year Treasury yield which the Fed does NOT control had FALLEN from 4.71% to 3.98%. While official rates have risen, market rates, and the cost of servicing loans in same, have fallen. Yet the acceleration of the US M3 money supply has plummeted. Why?
"Easy" Credit Versus Rising Prices:
Contrary to the most fondly held aspirations of all politicians and Central Bankers and most economists, it takes more than "low" interest rates to induce the massive borrowing necessary to sustain an inflationary credit expansion. It also takes an ever increasing DEMAND for the funds being offered to borrowers at the ever lower rates of interest. Since the short-lived recession at the beginning of the 1990s, the demand has come less and less from the productive sector of the US economy and more and more from US "consumers". What has happened over the past year in the US (and everywhere else) is a stark increase in the prices of things that consumers must consume, whether they want to or not. The US Treasury's measure of "core" price rises may exclude fuel and energy costs, but the US consumer cannot "exclude" them from their purchases. Over the past year, the cost of living in the US (and everywhere else) has been accelerating upwards. There comes a point in this process where both individuals and businesses cannot afford to borrow at ANY rate of interest, much as they might like to. The combination of the prices they must pay and the servicing costs of the debts they have already taken on have risen to the point where they are simply tapped out. They literally cannot afford to borrow any more. That precise situation is now rolling like a building tidal wave across most western economies.
Ó 2005 – The Privateer
http://www.the-privateer.com/
BEST OF BILL BUCKLER
June 20, 2005
What passes for economic and monetary theory inside the US today is simplicity itself. It is so basic that even Lord Keynes would blush to see it were he alive today. All it consists of is the idea that when any ongoing credit expansion shows signs of faltering, the solution is to overpower the real economic consequences which are now catching up with an even BIGGER credit expansion.
They even have a "name" for this so-called economic policy. They claim that they are "growing" the economy. If fact, what they are growing is the height of US debt outstanding (internal as well as all the external). No measure is out of bounds. The tax cuts are to enable Americans to service their higher debts. The result is that the US budget deficit has exploded. On top of that, the US has a current account deficit which the OECD expects to reach $US 900 Billion next year…..
Over the week to May 27, US M3 jumped $US 23.8 Billion to $US 9.622 TRILLION.
In one week, the US credit money machine created an additional US $23.8 Billion out of thin air. Those new US Dollars are now in full circulation. If the US Federal Reserve keeps this weekly rate of money creation up for a year it will have added an additional $US 1 TRILLION 237 Billion to the already outstanding stock of money in the US monetary system. This is where the global spill-over starts.
Let The Record Show:
The wider US M3 money supply has grown from $US 7.3 TRILLION at the start of 2001 to $US 9.622 TRILLION through May 2005. Over the mere four and one-half years from the start of 2001, the US money machine has decanted this additional $US 2 TRILLION 322 Billion on top of the pre-existing $US 7.3 TRILLION, which is an increase in the total stock of money in the USA of 31.8 percent in that time!….
The spectre which haunts the world is a sudden and out of control collapse in the international value of the grotesquely politically misused US Dollar. It is, after all, the world's reserve currency! Such a collapse would place under suspicion and ultimately expose every other fiat and credit currency. It would do none of them any good to claim that they had lots of foreign reserves, these are US Dollars!
But if they could point to a huge hoard of Gold, they just might ride out such a storm. As would you, gentle reader, if you just held 15 to 20 percent of your financial assets in Gold.
Ó 2005 – The Privateer
http://www.the-privateer.com
THE SUPPLY OF MONEY - AND THE DEMAND FOR MONEY
Here are some numbers which should make for very sobering reading indeed. They involve the rate of the expansion of the US broad money supply (M3) in the period since May 2004. Don't forget, the Fed began their series of official US rate rises - from a level of 1.0% - at the end of June 2004.
In late May 2004, US M3 was running at a year-to-date expansion rate of 11.0% annualised.
In the first week of June, exactly a year ago, the US M3 rate of expansion over the previous four weeks was reported to be running at a rate of 20% annualised.
In the first week of July 2004, just after the Fed's first 0.25% rate rise, the year-to-date expansion of the US M3 was 10.1% annualised - double the rate of the corresponding period of the previous year.
At the end of 2004, US M3 was reported to have expanded over the year at a rate of 6.6%.
As of June 3, 2005, the US M3 year-to-date expansion rate (to May 23) is reported to be 3.1%.
Finally, since the beginning of 2005 - again up to May 23 (the latest data reported) - US M3 has climbed from $US 9,479.2 Billion to $US 9,599.2 Billion. That's up $US 120 Billion or 1.27%.
As you can clearly see, the rate of expansion of the US "money supply", almost all of which is borrowed into existence, has radically slowed over the past year. This has happened despite the continuing increases in government spending and trade and current account deficits and despite the ongoing real estate mania in the US.
It is an old adage of rational financial economics that once a monetary inflation has begun, it takes ever larger dollops of new inflation to keep the entire structure from imploding. Amongst many other reasons, this is true because as the debt load incurred by the inflation increases, servicing costs for this debt grow. This effect can be delayed, somewhat, by the Central Bank artificially lowering interest rates - as the Fed did in 2001-03, but the effect of this artificial lowering of rates is to accelerate the borrowing. To illustrate this, the highest year-on-year increase in US M3 since 1981 - almost exactly $US 1TRILLION or 12.54% - came in 2001, the year when the Fed cut official US rates from 6.50% to 1.75%.
In August 1982, the start of an almost two-decade stock bull market in the US, US M3 stood at $US 2,400 Billion. It doubled to $US 4,800 by June 1996, just under 14 years later. Now, in the nine years since June 1996, the US M3 has doubled again to its present level of $US 9,600 Billion. There's the acceleration. Now go back and look at the data presented about more recent M3 movements. A year ago, the year-on-year expansion of US M3 was running at an 11.1% rate. Six months ago, it was 6.6%. Today, it is 3.1%. There's the DECELERATION!
Of course, the "stock" explanation of this drastic deceleration in monetary growth is that the Fed has TRIPLED official rates from 1.0% to 3.0% over the past year. Two factors are ignored in this explanation. The first is that the Fed has been offsetting its rate cuts with ever bigger "open market operations" by which it injects new money into the system. The second and more important factor is the drastic flattening of the US "yield curve". On June 3, 2004, the spread between three-month and ten-year Treasury rates was 355 basis points or 3.55%. On June 3, 2005, this spread was down to 99 basis points or 0.99%. The three-month Treasury yield which the Fed DOES control had risen from 1.16% to 2.99%. The ten-year Treasury yield which the Fed does NOT control had FALLEN from 4.71% to 3.98%. While official rates have risen, market rates, and the cost of servicing loans in same, have fallen. Yet the acceleration of the US M3 money supply has plummeted. Why?
"Easy" Credit Versus Rising Prices:
Contrary to the most fondly held aspirations of all politicians and Central Bankers and most economists, it takes more than "low" interest rates to induce the massive borrowing necessary to sustain an inflationary credit expansion. It also takes an ever increasing DEMAND for the funds being offered to borrowers at the ever lower rates of interest. Since the short-lived recession at the beginning of the 1990s, the demand has come less and less from the productive sector of the US economy and more and more from US "consumers". What has happened over the past year in the US (and everywhere else) is a stark increase in the prices of things that consumers must consume, whether they want to or not. The US Treasury's measure of "core" price rises may exclude fuel and energy costs, but the US consumer cannot "exclude" them from their purchases. Over the past year, the cost of living in the US (and everywhere else) has been accelerating upwards. There comes a point in this process where both individuals and businesses cannot afford to borrow at ANY rate of interest, much as they might like to. The combination of the prices they must pay and the servicing costs of the debts they have already taken on have risen to the point where they are simply tapped out. They literally cannot afford to borrow any more. That precise situation is now rolling like a building tidal wave across most western economies.
Ó 2005 – The Privateer
http://www.the-privateer.com/
VICE GRIP
On market it has
Triple topped, already above 2000 highs, anything possible, but I don't see this ratio rises much above that triple top if at all.
As suggested a do nothing low volume get out of town day. You heard it here, but not a PEEP anywhere else on huge help wanted index mix, back to 37 !
Yes odd day where gold falls $8 but stocks hardly affected, still pondering that....gold followed Silver as also suggested.
No mention from the gold bug squad of declining tops in most prestigious gold stock, most widely held NEM, and the SILVER non confirm.
2nd Chance body armour company being sued by US over knowingly selling FAULTY BODY ARMOUR !!!!!
D
Triple topped, already above 2000 highs, anything possible, but I don't see this ratio rises much above that triple top if at all.
As suggested a do nothing low volume get out of town day. You heard it here, but not a PEEP anywhere else on huge help wanted index mix, back to 37 !
Yes odd day where gold falls $8 but stocks hardly affected, still pondering that....gold followed Silver as also suggested.
No mention from the gold bug squad of declining tops in most prestigious gold stock, most widely held NEM, and the SILVER non confirm.
2nd Chance body armour company being sued by US over knowingly selling FAULTY BODY ARMOUR !!!!!
D
STOCK OPTIONS MUST BE EXPENSED
Stock options must be expensed
By Matt Krantz, USA TODAY (dec 2004)
Count one for the bean counters.
After years of heated debate between high-tech companies and accountants, the head accounting rule-setting body Thursday declared all companies must subtract the cost of stock options from their earnings starting in mid-2005.
It's a massive blow for companies, mainly in Silicon Valley, which had been doling out lucrative stock options to employees and executives for decades but not counting them as a cost. It also requires investors to rethink how they value companies: The new rule will affect everything from price-earnings ratios to earnings estimates.
Accountants, thinking companies had been enjoying a loophole that understated their costs, applauded the decision. The new rule will have "a big impact, but it's the right move," says Ed Nusbaum, CEO of accounting firm Grant Thornton.
The rule change, approved by the Financial Accounting Standards Board, represents a massive shift because it:
•Affects so many companies. Only 117 companies in the Standard & Poor's 500 index currently expense options, says David Zion, accounting analyst at Credit Suisse First Boston. That means a majority will need to start.
•Puts a big dent into reported earnings. Had all companies in the S&P 500 expensed the cost of options, reported earnings would have been 20% lower in 2001, 19% lower in 2002 and 8% lower last year, Zion says. He says the rule could dent 2005 earnings 3%.
•Has massive effects on individual companies. Not surprisingly, tech companies that have relied on stock options to retain employees stand to suffer a big hit to earnings.
Consider Internet site Yahoo. Had the company been required to expense stock options last year, it would have reported earnings of 5 cents a share, 86% less than the 37 cents a share profit it reported. That makes a giant change in Yahoo's P-E on 2003 earnings: 742 under the new rule, vs. 100 before.
•Affects earnings estimates. It's still unclear if Wall Street analysts will ignore the new charge, or include it in the earnings estimates that investors watch, says David Dropsey, analyst with First Call.
High-tech firms are not pleased. "We remain opposed to expensing and will continue to work with the Congress, the administration and the SEC to come to an accurate, auditable, transparent solution," says Cisco Systems' spokesman John Earnhardt.
Sen. Peter Fitzgerald, R.-Ill., one of the rule's champions, says he fears companies will wait for his retirement this year and try to derail the rule before it kicks in June 15.
Silicon Valley companies "will stop at nothing to stop this (rule) from going into effect," he says.
By Matt Krantz, USA TODAY (dec 2004)
Count one for the bean counters.
After years of heated debate between high-tech companies and accountants, the head accounting rule-setting body Thursday declared all companies must subtract the cost of stock options from their earnings starting in mid-2005.
It's a massive blow for companies, mainly in Silicon Valley, which had been doling out lucrative stock options to employees and executives for decades but not counting them as a cost. It also requires investors to rethink how they value companies: The new rule will affect everything from price-earnings ratios to earnings estimates.
Accountants, thinking companies had been enjoying a loophole that understated their costs, applauded the decision. The new rule will have "a big impact, but it's the right move," says Ed Nusbaum, CEO of accounting firm Grant Thornton.
The rule change, approved by the Financial Accounting Standards Board, represents a massive shift because it:
•Affects so many companies. Only 117 companies in the Standard & Poor's 500 index currently expense options, says David Zion, accounting analyst at Credit Suisse First Boston. That means a majority will need to start.
•Puts a big dent into reported earnings. Had all companies in the S&P 500 expensed the cost of options, reported earnings would have been 20% lower in 2001, 19% lower in 2002 and 8% lower last year, Zion says. He says the rule could dent 2005 earnings 3%.
•Has massive effects on individual companies. Not surprisingly, tech companies that have relied on stock options to retain employees stand to suffer a big hit to earnings.
Consider Internet site Yahoo. Had the company been required to expense stock options last year, it would have reported earnings of 5 cents a share, 86% less than the 37 cents a share profit it reported. That makes a giant change in Yahoo's P-E on 2003 earnings: 742 under the new rule, vs. 100 before.
•Affects earnings estimates. It's still unclear if Wall Street analysts will ignore the new charge, or include it in the earnings estimates that investors watch, says David Dropsey, analyst with First Call.
High-tech firms are not pleased. "We remain opposed to expensing and will continue to work with the Congress, the administration and the SEC to come to an accurate, auditable, transparent solution," says Cisco Systems' spokesman John Earnhardt.
Sen. Peter Fitzgerald, R.-Ill., one of the rule's champions, says he fears companies will wait for his retirement this year and try to derail the rule before it kicks in June 15.
Silicon Valley companies "will stop at nothing to stop this (rule) from going into effect," he says.
EWT on CONSUMER CONFIDENCE and MARKETS
Does a 3-year high in consumer confidence challenge your current forecast?
Category: Specific Markets
The Consumer Confidence Index has been rising over the last couple of months. Is it a lagging indicator of stock market trends? If so, then the strong June number released on Tuesday (June 28) must indicate that consumers are simply reacting to the stock rally since April... Although, doesn't this 3-year high in consumer confidence negate the likelihood of a "downside explosion that alters the face of the U.S. economy occurring over the next few months?" That's a quote from your June Elliott Wave Financial Forecast.
Responder: Multi-Author
Date: 6/29/2005
While these reports have no value in predicting price action beyond the span of a few minutes, an emotional reaction to these reports is often useful for timing a short-term entry or exit point in the market. Consumer confidence is indeed high right now. But here's a pop quiz: When did the all-time record high for consumer confidence occur? October 1968, with a reading of 142.3. Significant? You bet. The DJIA topped two months later (Dec. 2 at 994.60) and declined 36% over the next 18-months to a low in May 1970 (May 26 at 627.40). At the time, that decline in stocks was the largest percentage sell-off in well over 20 years. Yet how could that happen with the U.S. consumer so confident? Well, the markets are moved by mass psychology rather than cold, hard reason. You'll get frustrated if you expect mass psychology to be rational, so don't waste time trying to make sense of it. We don't see a serious challenge to our view of an ongoing bear market in recent economic reports. In light of what we currently see in the wave structure, reports like the June consumer confidence seem more consistent with a bear market rally than the beginnings of a bull market. Wave patterns in the stock market indexes are our primary sources of information regarding social mood. Economic reports are secondary, and as such are best used to confirm or challenge wave-based forecasts. We don't want to let positives in a secondary source take precedence over more substantive information coming from our primary source -- wave patterns. See The Wave Principle of Human Social Behavior for a detailed discussion of these concepts.
Category: Specific Markets
The Consumer Confidence Index has been rising over the last couple of months. Is it a lagging indicator of stock market trends? If so, then the strong June number released on Tuesday (June 28) must indicate that consumers are simply reacting to the stock rally since April... Although, doesn't this 3-year high in consumer confidence negate the likelihood of a "downside explosion that alters the face of the U.S. economy occurring over the next few months?" That's a quote from your June Elliott Wave Financial Forecast.
Responder: Multi-Author
Date: 6/29/2005
While these reports have no value in predicting price action beyond the span of a few minutes, an emotional reaction to these reports is often useful for timing a short-term entry or exit point in the market. Consumer confidence is indeed high right now. But here's a pop quiz: When did the all-time record high for consumer confidence occur? October 1968, with a reading of 142.3. Significant? You bet. The DJIA topped two months later (Dec. 2 at 994.60) and declined 36% over the next 18-months to a low in May 1970 (May 26 at 627.40). At the time, that decline in stocks was the largest percentage sell-off in well over 20 years. Yet how could that happen with the U.S. consumer so confident? Well, the markets are moved by mass psychology rather than cold, hard reason. You'll get frustrated if you expect mass psychology to be rational, so don't waste time trying to make sense of it. We don't see a serious challenge to our view of an ongoing bear market in recent economic reports. In light of what we currently see in the wave structure, reports like the June consumer confidence seem more consistent with a bear market rally than the beginnings of a bull market. Wave patterns in the stock market indexes are our primary sources of information regarding social mood. Economic reports are secondary, and as such are best used to confirm or challenge wave-based forecasts. We don't want to let positives in a secondary source take precedence over more substantive information coming from our primary source -- wave patterns. See The Wave Principle of Human Social Behavior for a detailed discussion of these concepts.
SILVER UPDATE
Now BELOW uptend line and below $7, if selling now intensifies, gold SHOULD follow.
Is SILVER telling us economy IS slowing? along with bond yields?
D
Is SILVER telling us economy IS slowing? along with bond yields?
D
FRIDAY PRE- MARKET COMMENTS
Europe up, JAPAN UP, US Futures UP. Monday the market is closed for July 4th holiday.
POssible set up, operators will try and PUSH the market UP at the open, and distribute more stock to the lemmings. ENd of month markups, might include taking some profits.
VIX narely budged along with put call ratio (CPC) as if sell off was a yawner, no worry. Market may need to work off short term oversold, but market rallied from a rather neutral position earlier in month and so any intermediate oversold didn;t materialize for stronger base. Leaves me to believe when seasonal strength wanes, some SERIOUS selling may ensue.
SILVER still showing weakness in relation to GOLD. Gold Bugs hardly mention this action. ONLY WHEN we have TRUE flae up in inflation will gold be the place to be, or after everyone begins talking about Deflation again, would some inflation be possible. Money worldwide would be printed to get out of that scenario, you would WANT to be holding some gold and unhedged gold shares. I am choosing to wait for now, unless SILVER can rise above $7.60 or so.
I also expect today's action to be light on VOLUME, as some traders choose to get away early for vacation. THIS also sets up ossible intra day reversal to downside after opening push fizzles on low volume. IMHO
5 YR notes at 3.74% 10 yr 3.94% FED FUNDS 3.25% The Greenspan conundrum, but not for us!
if you would like me to continue pre market and after market comments in this manner ( I will still post my usual links etc when I can) let me know. Duratek@yahoo.com
It may be that I do this 3X a week like M
ALL have a great weekend and Holiday. G-d protect our fighting men who are in battle as far as they know to protect our way of life and freedom, regardless of Bush agenda!
Duratek
POssible set up, operators will try and PUSH the market UP at the open, and distribute more stock to the lemmings. ENd of month markups, might include taking some profits.
VIX narely budged along with put call ratio (CPC) as if sell off was a yawner, no worry. Market may need to work off short term oversold, but market rallied from a rather neutral position earlier in month and so any intermediate oversold didn;t materialize for stronger base. Leaves me to believe when seasonal strength wanes, some SERIOUS selling may ensue.
SILVER still showing weakness in relation to GOLD. Gold Bugs hardly mention this action. ONLY WHEN we have TRUE flae up in inflation will gold be the place to be, or after everyone begins talking about Deflation again, would some inflation be possible. Money worldwide would be printed to get out of that scenario, you would WANT to be holding some gold and unhedged gold shares. I am choosing to wait for now, unless SILVER can rise above $7.60 or so.
I also expect today's action to be light on VOLUME, as some traders choose to get away early for vacation. THIS also sets up ossible intra day reversal to downside after opening push fizzles on low volume. IMHO
5 YR notes at 3.74% 10 yr 3.94% FED FUNDS 3.25% The Greenspan conundrum, but not for us!
if you would like me to continue pre market and after market comments in this manner ( I will still post my usual links etc when I can) let me know. Duratek@yahoo.com
It may be that I do this 3X a week like M
ALL have a great weekend and Holiday. G-d protect our fighting men who are in battle as far as they know to protect our way of life and freedom, regardless of Bush agenda!
Duratek
STEPPED UP INSURGENCY In AFGHAN?
Troubling developments in the war on terror, IF it will be fought on 2 FRONTS, there are not many troops in Afghanistan! Surely these developments should be ignored by the market and US Citizens, and strong focus should be on how many DVD copies PIXR sold.
WHY do you think the US Armed Forces is dumping BAGS OF MONEY as inducement for NEW RECRUITS? It's most lucrative offer ever. Because they are NOT fulfilling their quota's, and are having a very difficult time luring in new recruits.
D
WHY do you think the US Armed Forces is dumping BAGS OF MONEY as inducement for NEW RECRUITS? It's most lucrative offer ever. Because they are NOT fulfilling their quota's, and are having a very difficult time luring in new recruits.
D
Thursday, June 30, 2005
THE BATTLE BEGINS...TARRIFS NEXT?
CNOOC BLOCKED BY CONGRESS The great Depression was brought about in part by protectionist US policies.
Duratek......be careful now, be very careful. YIELD STILL coveted like fine china
Duratek......be careful now, be very careful. YIELD STILL coveted like fine china
100 POINT WOOF!
Of note: CPC .71 VIX 12 ?? VOLUME EXPANDS ON DECLINE
STILL no need for protection? OK!
D
STILL no need for protection? OK!
D
FED'S RAISE TO 3.25% Funds Rate
STory here "NEUTRAL" is said to be 1% higher at 4.25%. Head fake was mkt rising, now in some decline.
5 YEARS OF RECORD HOUSING NUMBERS.........5 YEARS!
HOW much gas in tank I ask? MY international friends, (and I saw this in Ireland last year when I visited) you have also seen housing prices RISE more than they have right to, KILLING first time buyers and strapping them with debt.
And the WORLD seems sychronized, but not to the good, with LOW LOW interest rates, WHY isn't anyone asking why is this happening?
D
5 YEARS OF RECORD HOUSING NUMBERS.........5 YEARS!
HOW much gas in tank I ask? MY international friends, (and I saw this in Ireland last year when I visited) you have also seen housing prices RISE more than they have right to, KILLING first time buyers and strapping them with debt.
And the WORLD seems sychronized, but not to the good, with LOW LOW interest rates, WHY isn't anyone asking why is this happening?
D
FOMC
Open market committee here you view last 15 years of action on rates.
It held at near historic LOW of 1% for ONE YEAR! You may not find another time in history that ever happened.
And as many things happening now are historic extremes, I ask WHY then should you approach your life blood, your investments as "business as usual"?
D
It held at near historic LOW of 1% for ONE YEAR! You may not find another time in history that ever happened.
And as many things happening now are historic extremes, I ask WHY then should you approach your life blood, your investments as "business as usual"?
D
Wednesday, June 29, 2005
Like Candy From A baby
OIL delcines.
ORCL beats.
Seasonal strength pre July 4th
Peppy Bush speach
futures were green
hedgies, playa's need rise
bonds were rallying (rates falling)
GDP rises at faster pace
inflation tame?
Market is red. (for now) it seems ALL this good news is a yawner.....or could they possibly be so anal as to worry about the FED meeting Thursday? EVERYONE knows what is coming.....yet they will mince and disect every stupid word they release.
The economy cannot support itself, YANK away low rates and it's over.
Duratek
ORCL beats.
Seasonal strength pre July 4th
Peppy Bush speach
futures were green
hedgies, playa's need rise
bonds were rallying (rates falling)
GDP rises at faster pace
inflation tame?
Market is red. (for now) it seems ALL this good news is a yawner.....or could they possibly be so anal as to worry about the FED meeting Thursday? EVERYONE knows what is coming.....yet they will mince and disect every stupid word they release.
The economy cannot support itself, YANK away low rates and it's over.
Duratek
Subscribe to:
Posts (Atom)